
 Tumbles 5% Amid U.S.-Israel Tehran Strikes – Critical Support Zones in Focus")
TLDR
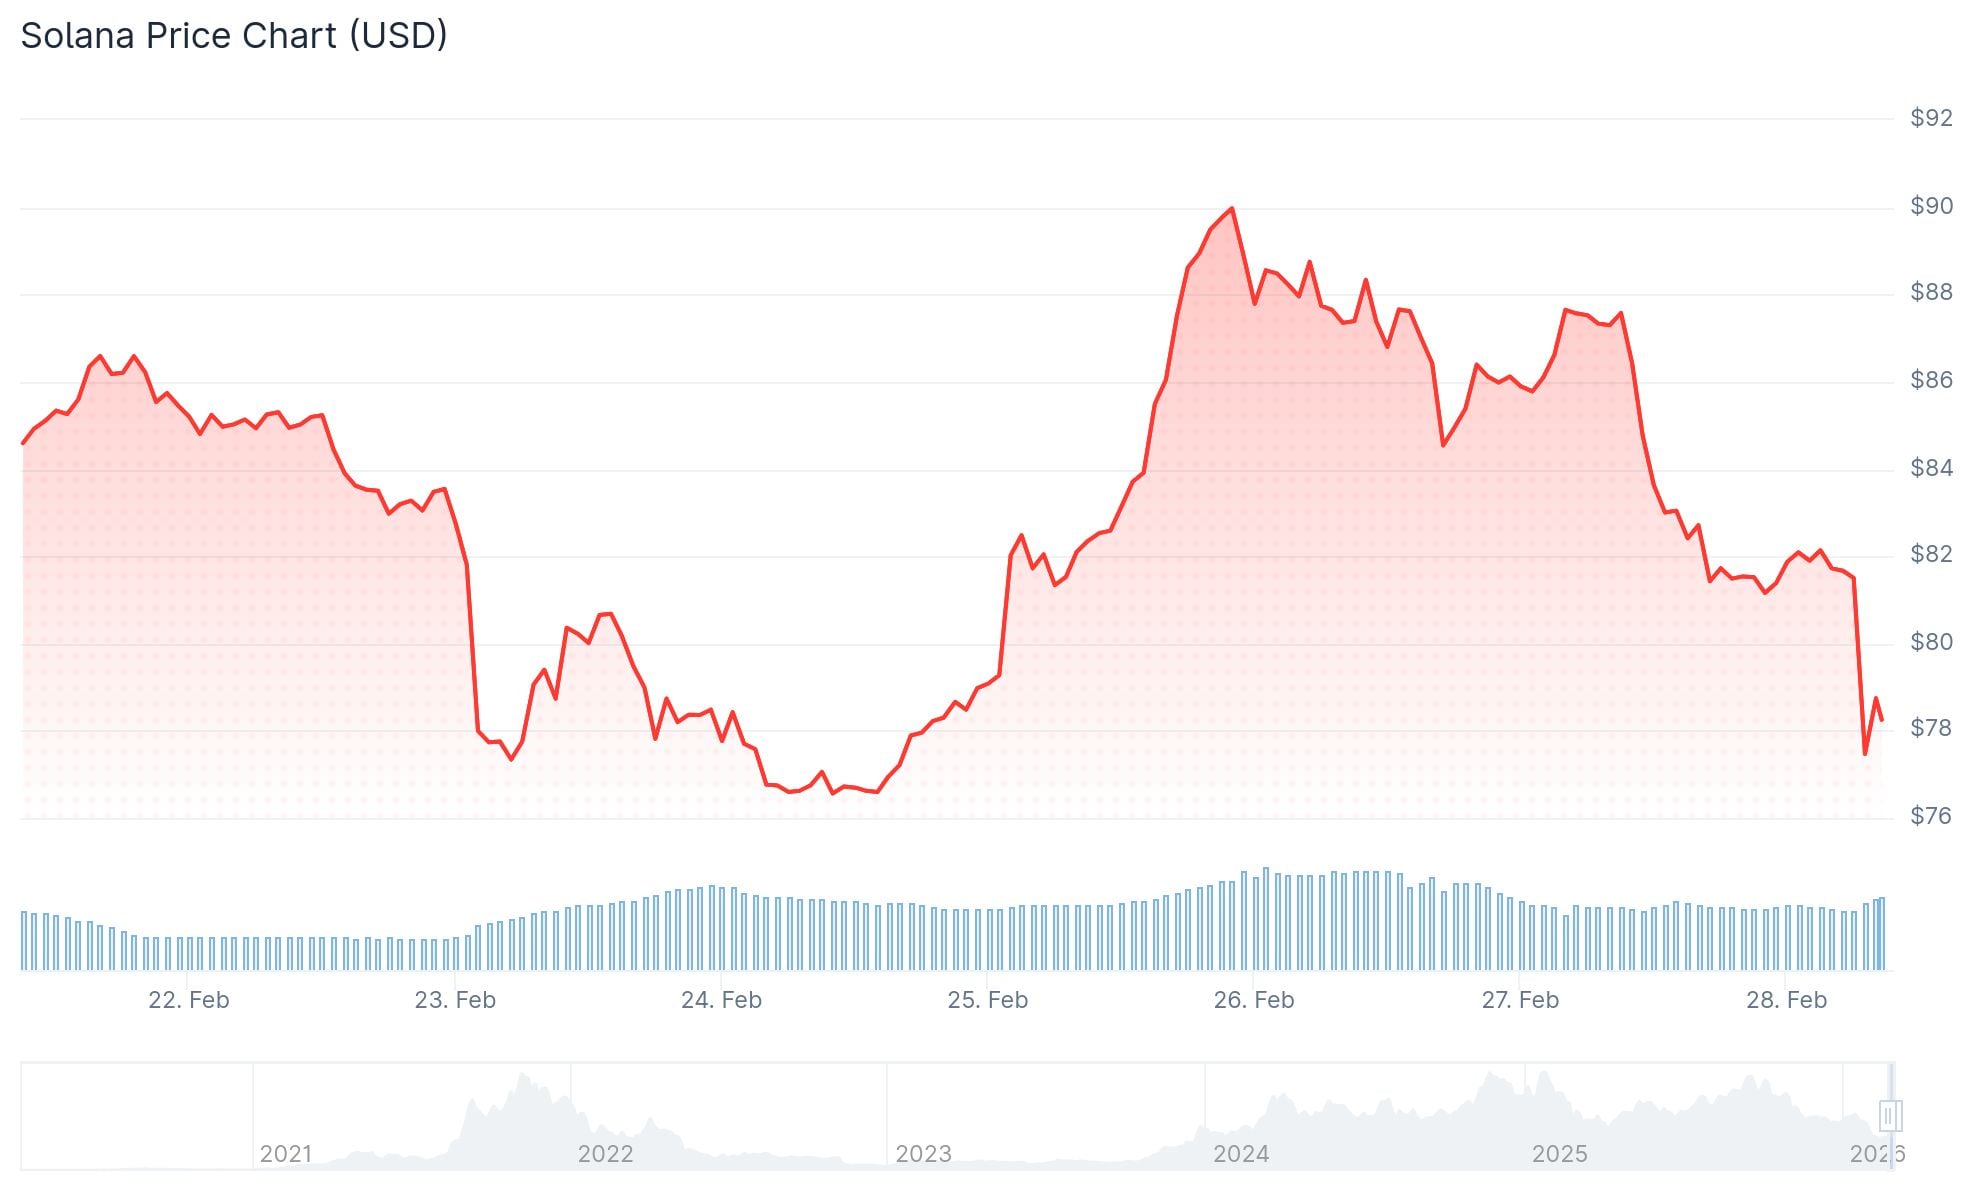
- SOL has retreated 72% from its peak of $295, currently hovering near $78
- Solana’s spot ETFs experienced modest outflows of $11.3M, significantly less than Bitcoin and Ethereum ETFs facing four straight months of withdrawals
- DEX volume on Solana reached $108 billion over 30 days, surpassing Ethereum’s $63.7 billion
- Technical analysts identify critical support zones at $50, $22, and $10 using Parallel Channel analysis
- Escalating tensions between Israel and Iran sparked widespread cryptocurrency liquidations, driving Bitcoin close to $60,000 and weighing on altcoins like SOL
The Solana token is changing hands at $78, representing a 72% decline from its record high of $295. This downturn reflects a wider cryptocurrency market correction, intensified by geopolitical developments on February 28, 2026.
Saturday morning witnessed Israel conducting military operations against Iranian targets, with U.S. involvement confirmed by Associated Press sources. Bitcoin plummeted nearly 5% within minutes, approaching the $60,000 threshold, while the broader selloff impacted alternative cryptocurrencies including SOL.
While prices have declined, Solana’s underlying network metrics demonstrate resilience. The blockchain recorded $108 billion in decentralized exchange activity over the past month, outperforming Ethereum’s $63.7 billion and Base’s $31.48 billion.
Within the previous 24-hour period, Solana applications generated $3.1 million in revenue compared to Ethereum’s $2.95 million. The network registered 2.17 million active addresses, substantially exceeding Ethereum’s 682,236.

Solana’s real-world asset ecosystem has achieved a new milestone of $1.71 billion, representing a 45% increase over the past 30 days.
SOL ETF Flows Remain Relatively Stable
Spot Solana ETFs debuted in late October 2025, attracting more than $100 million in average net inflows throughout their initial five-week period. Weekly capital inflows have subsequently moderated to the $20–$25 million range alongside price depreciation.
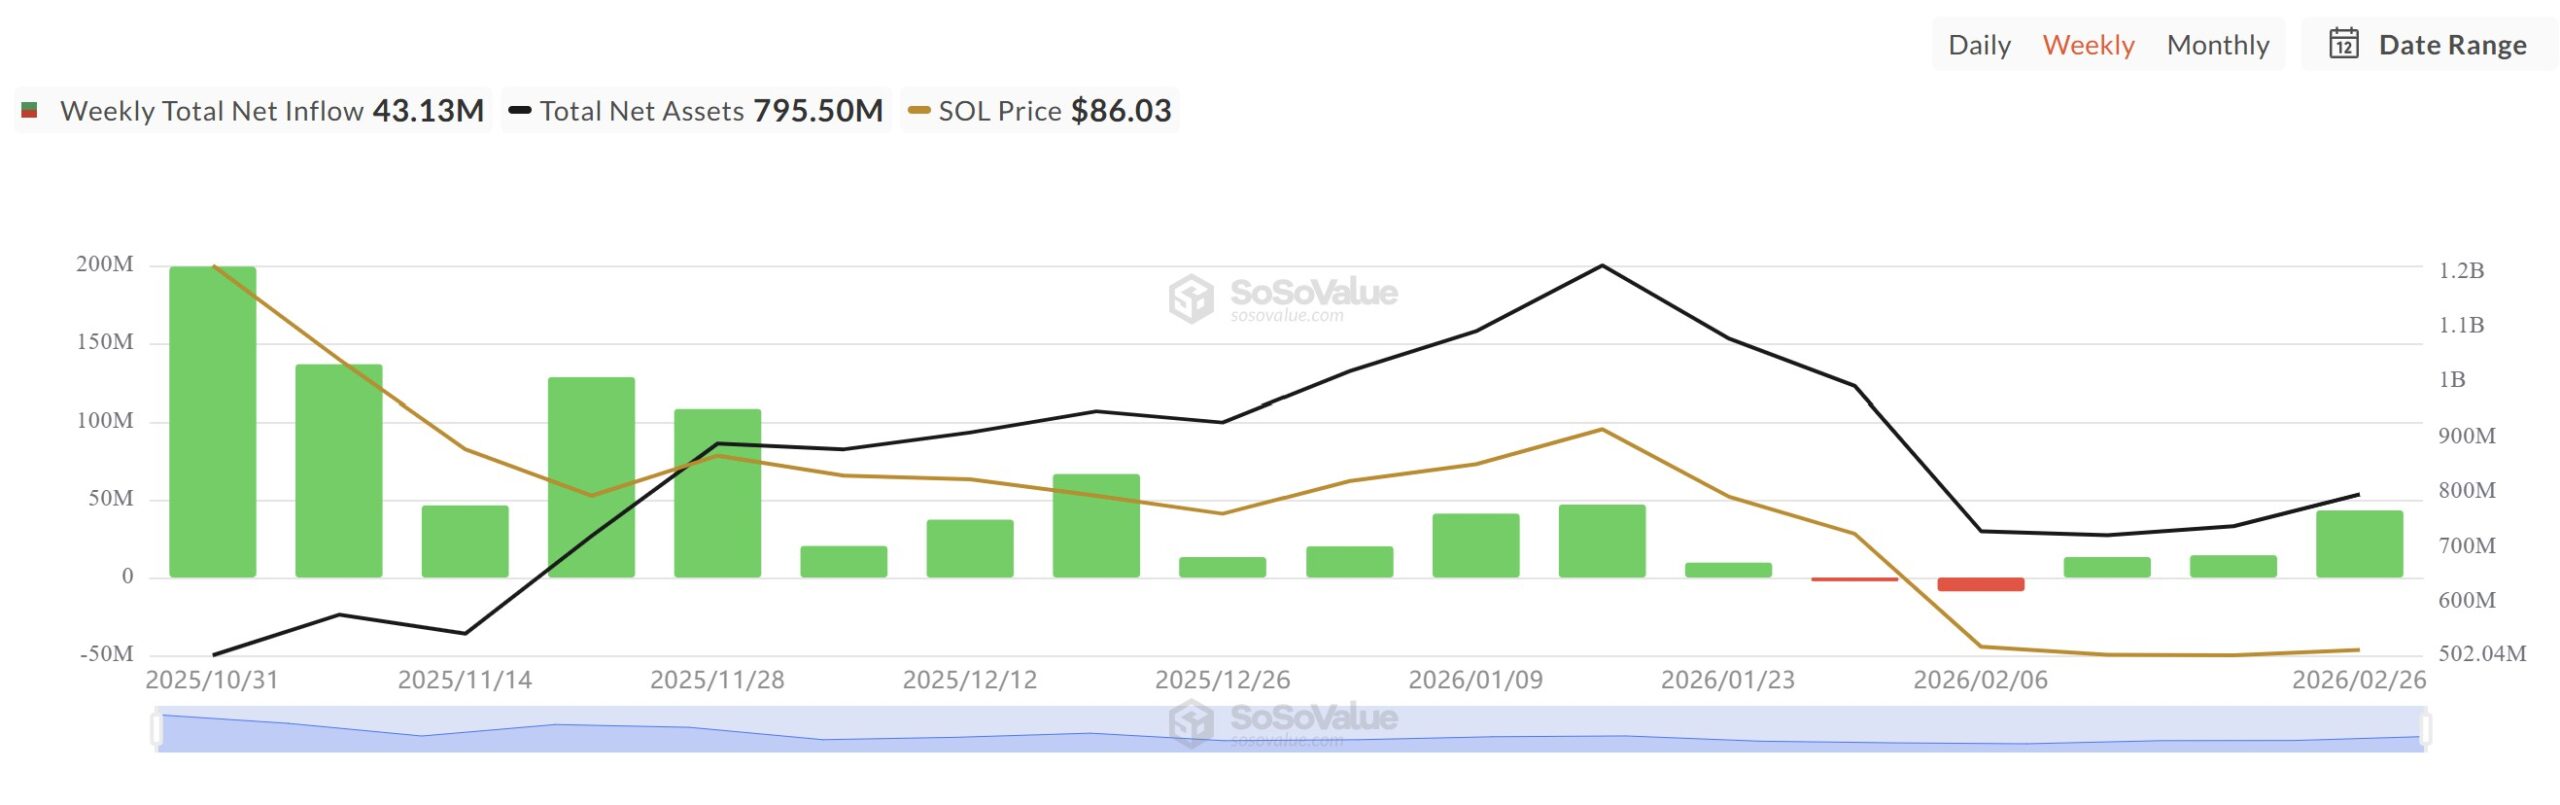
Total outflows during the four-month downturn amount to merely $11.3 million across two weeks. In comparison, Bitcoin and Ethereum ETFs recorded four consecutive months of net negative flows during the identical timeframe.
Solana is presently trading considerably beneath the $188 price point observed during its ETF debut.
Critical Support Zones Under Surveillance
Crypto analyst Ali Martinez highlighted a Parallel Channel formation emerging on SOL’s weekly timeframe. This technical structure suggests support thresholds at $50.22, $22.47, and $9.98.
Analyst Crypto Scient pinpointed two supplementary zones of interest. The primary area encompasses the 0.75 Fibonacci retracement level spanning $60 to $70. The secondary zone represents a weekly demand fair value gap ranging from $22 to $29.
Glassnode’s UTXO analytics reveal that over 6% of SOL’s circulating supply last transacted within the present price range. The subsequent significant supply concentration, exceeding 3%, exists between $20 and $30.
SOL remains beneath the weekly resistance threshold of $120. The $51 to $80 corridor on weekly charts has undergone testing and corresponds with the retracement area under analyst observation.
As of February 28, 2026, SOL was valued at $78 while markets processed developments from the Israel-Iran military engagement.