
 Stock: Major Whales Loading Up During Consolidation Phase – What’s Coming?")
Key Takeaways
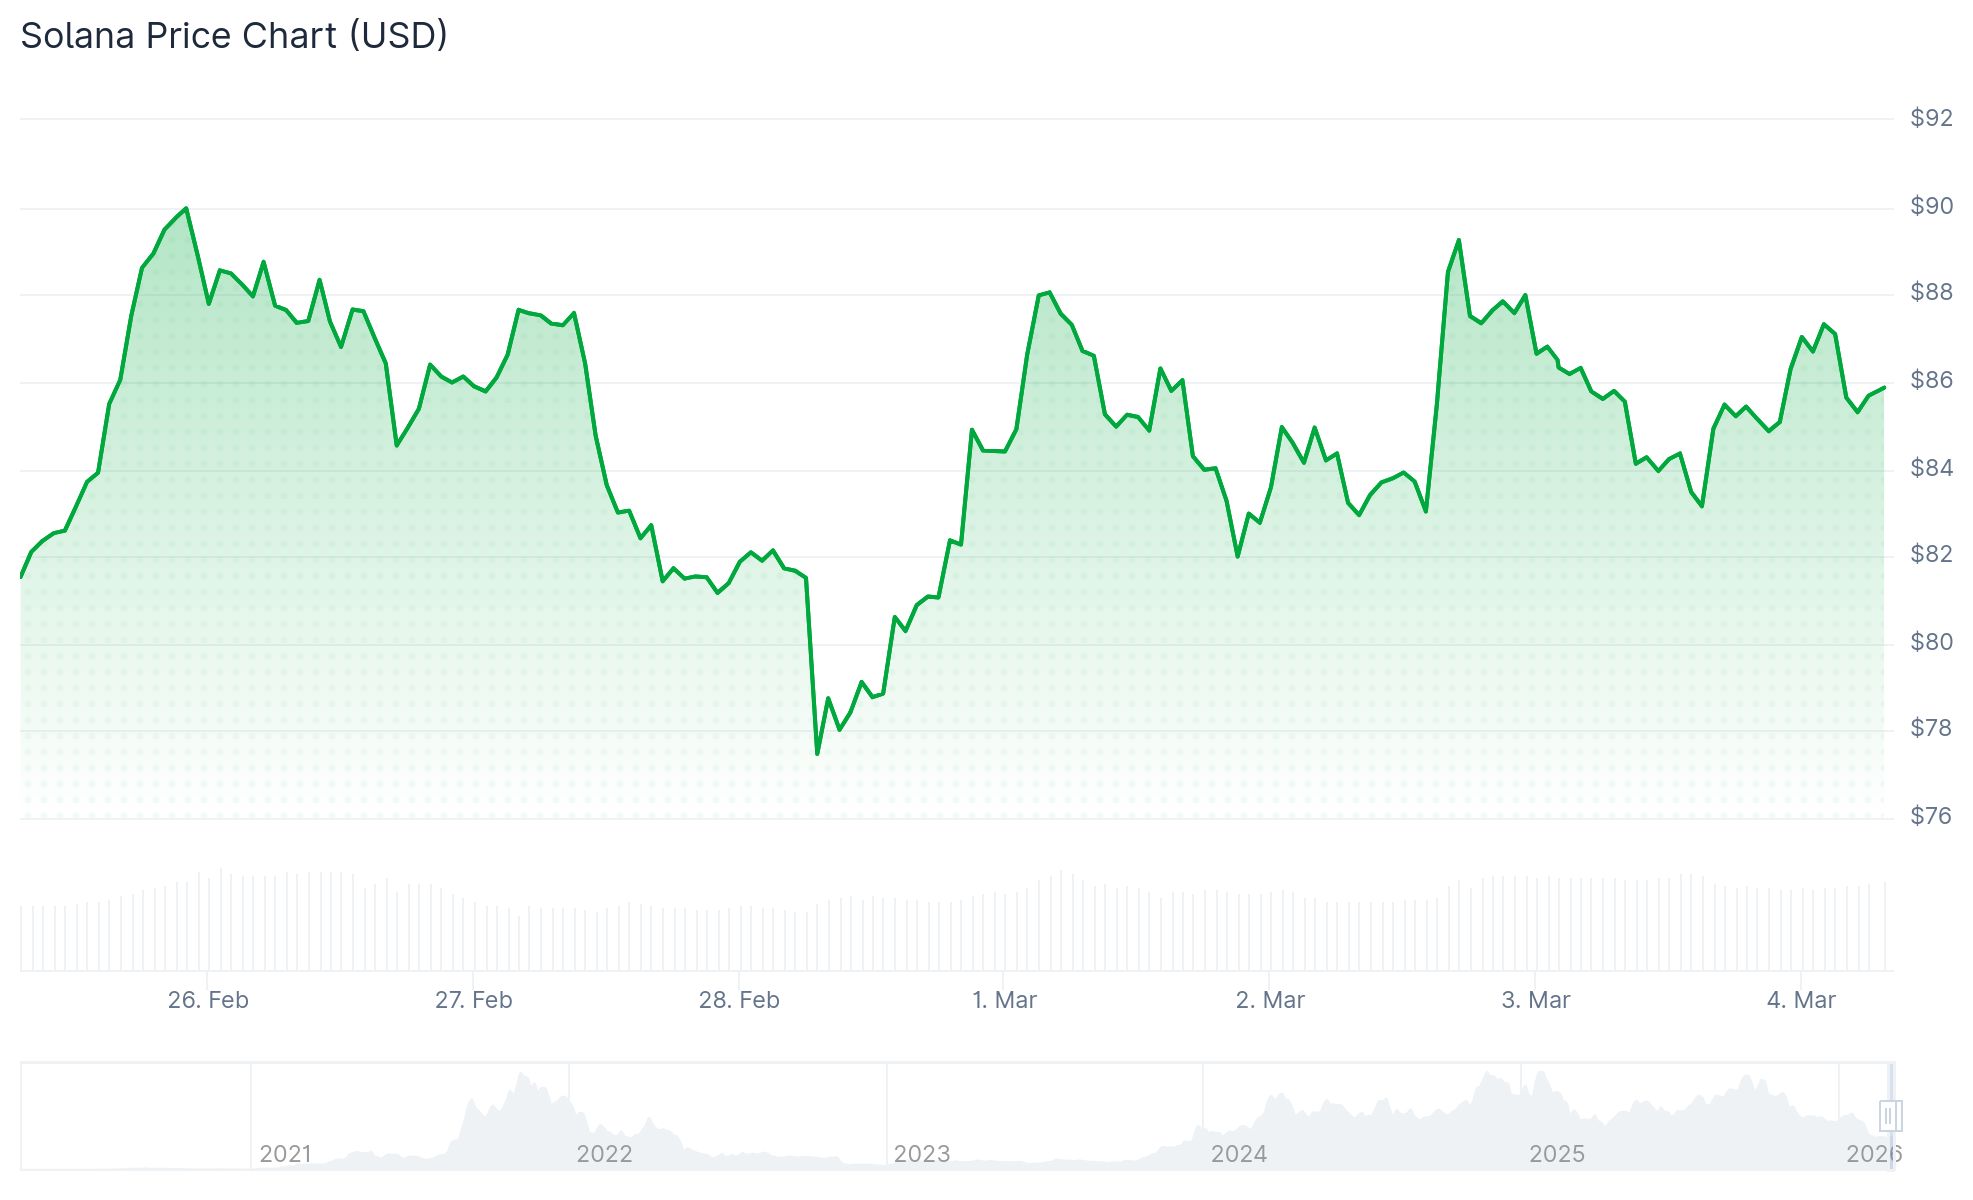
- SOL price has consolidated in a narrow $78-$90 corridor for approximately 30 days, suggesting an accumulation phase.
- Blockchain transaction volumes increased 19.1% week-over-week, while trading volume surged from $22B to $34B.
- Exchange-traded funds tracking SOL recorded $18.44 million in net inflows during a two-day period, following $44.44 million the previous week.
- Breaking decisively above the $90-$92 zone may trigger upside movement toward $100, potentially extending to $137 (200-day exponential moving average).
- Failure to maintain $78 support could result in downside price action toward $67.
Solana has maintained a relatively stable trading range throughout the past four weeks, oscillating within the $78 to $90 boundaries. This period of indecision reflects neither bullish nor bearish dominance, creating a classic consolidation pattern.
Large wallet holders have demonstrated consistent activity at both extremes of this range — accumulating positions around $78 and distributing near $90. This cyclical behavior has characterized price movement throughout mid-to-late February.
On February 12, SOL successfully defended the $78 support level before rebounding to $90 within a three-day window. An identical pattern emerged on February 24.
Currently, SOL is changing hands near $85, after briefly approaching $88 before experiencing modest retracement.

The asset remains positioned beneath the upper boundary of a parallel channel formation at $87.96, creating immediate overhead resistance.
Blockchain Metrics Show Strengthening Fundamentals
Network data compiled by Artemis reveals weekly transaction counts expanded from 764 million to 910 million units — representing a 19.1% weekly gain.
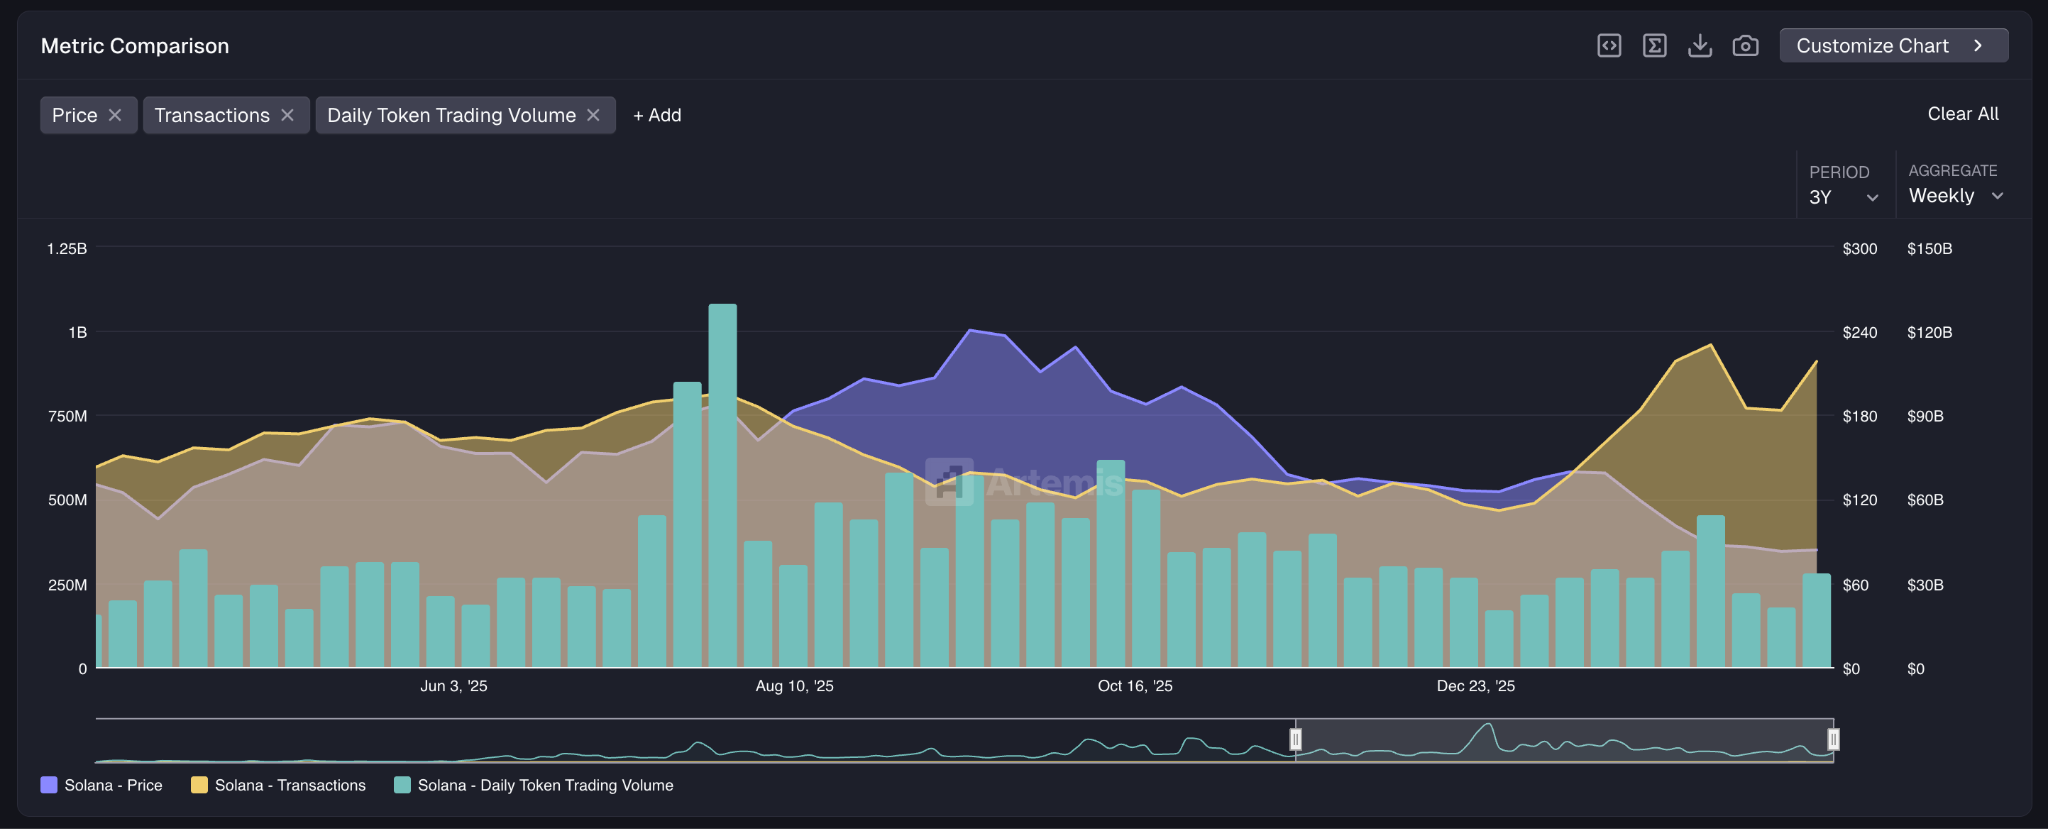
Weekly unique wallet addresses also expanded, approaching peak levels observed in 2026 for this particular metric.
Total trading volumes for SOL expanded from $22 billion to $34 billion within seven days, indicating growing market participation as price repeatedly validates the $78 support zone.
Institutional Capital Flows Through ETF Vehicles
Spot exchange-traded funds tracking SOL registered $1.03 million in net positive flows on Tuesday, supplementing the $17.41 million recorded the prior trading session — combining for $18.44 million across two days.
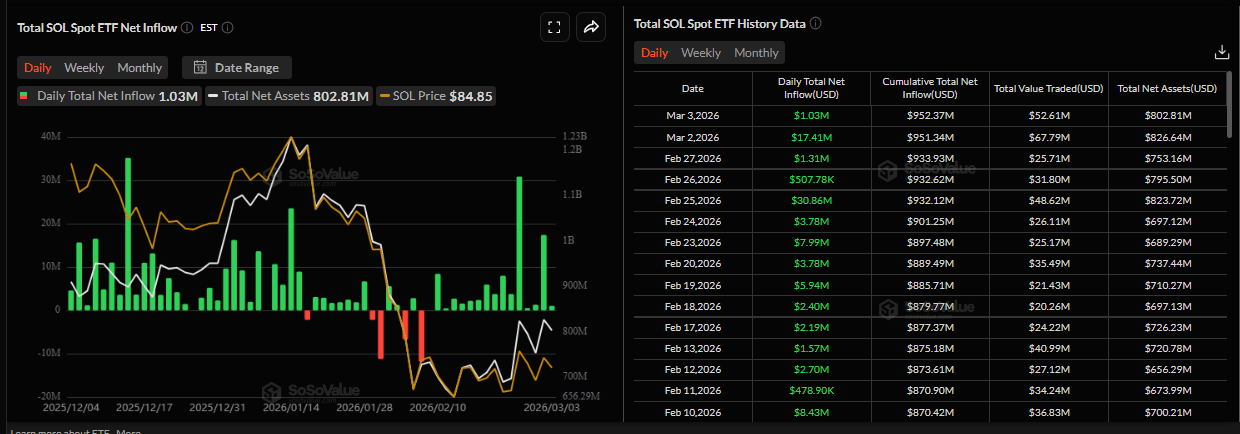
The preceding seven-day period witnessed $44.44 million in ETF capital inflows, marking the strongest weekly performance since mid-January.
Funding rates across derivatives platforms transitioned to positive territory on Wednesday at 0.0008%, indicating emerging bullish positioning among leveraged traders.
The Relative Strength Index on daily timeframes has rebounded toward the mid-40s from previously oversold readings, while the MACD indicator maintains positive momentum.
Immediate resistance emerges at the 23.6% Fibonacci retracement level of $86.60, with the 38.2% retracement at $98.42 coinciding with the 50-day EMA above current price.
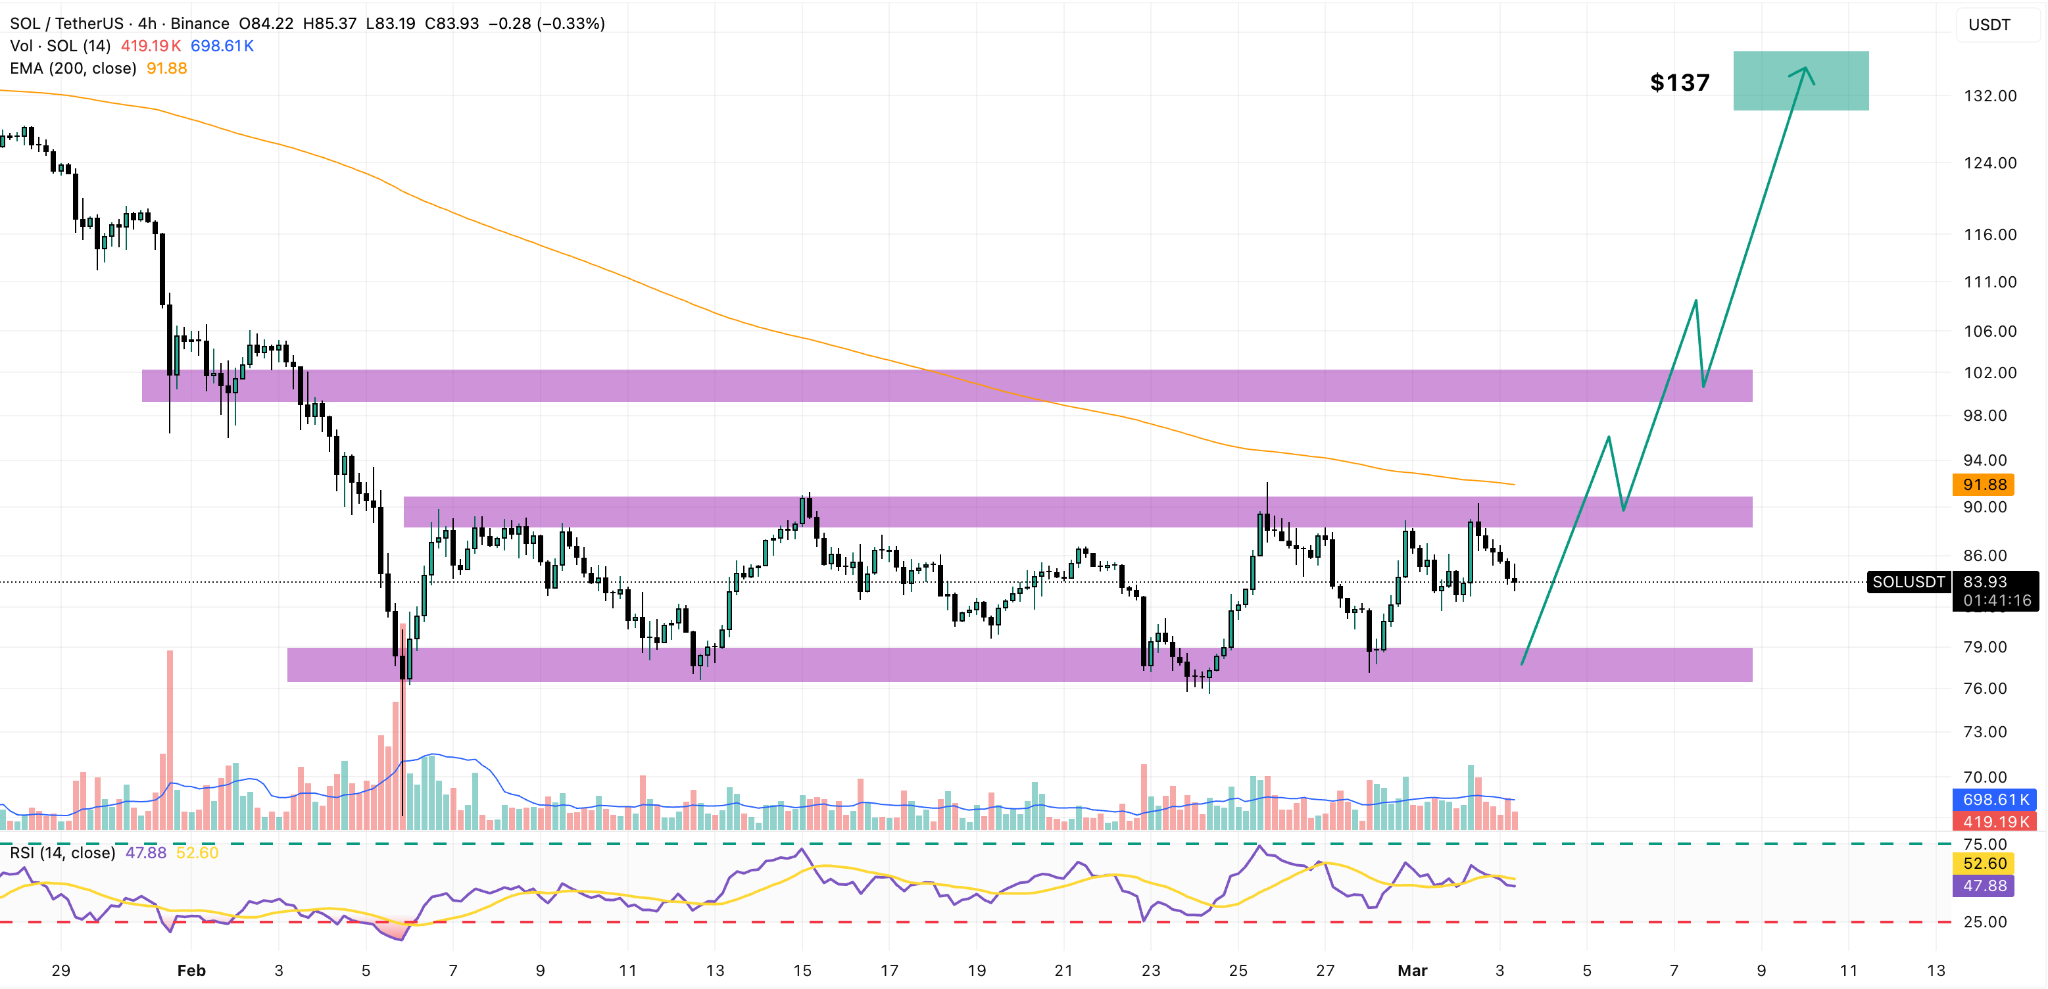
A confirmed daily close above $92 could activate movement toward $106, and breaching that threshold would bring $120 into realistic consideration as an upside objective.
The 200-period exponential moving average on daily charts currently resides at $137 — representing potential 63% upside from present valuation levels should SOL achieve a sustained breakout.
Downside support structure begins at $77.60, with a secondary floor established at the previous swing low of $67.50.
Market analysts consider $80 a pivotal level — losing this threshold would likely accelerate Solana downward toward $75 or potentially $70.
Two separate buy signals generated on hourly charts both activated near $78 and successfully reached the $90 target zone, producing returns of 4.4x and 2.3x respectively.
SOL has appreciated 9.3% during the trailing seven-day period, establishing it as the strongest performer among the top five cryptocurrencies by market capitalization over that timeframe.