
 Stock Eyes 30% Surge If Critical $90 Support Holds Firm")
Quick Overview
- SOL maintains position around the $89–$90 range, with buyers defending this critical support zone.
- Clearing the $90 resistance could open the path to $120, representing approximately 30% upside.
- Market activity increased 30% during the last 30 days, with volume temporarily nearing $5 billion.
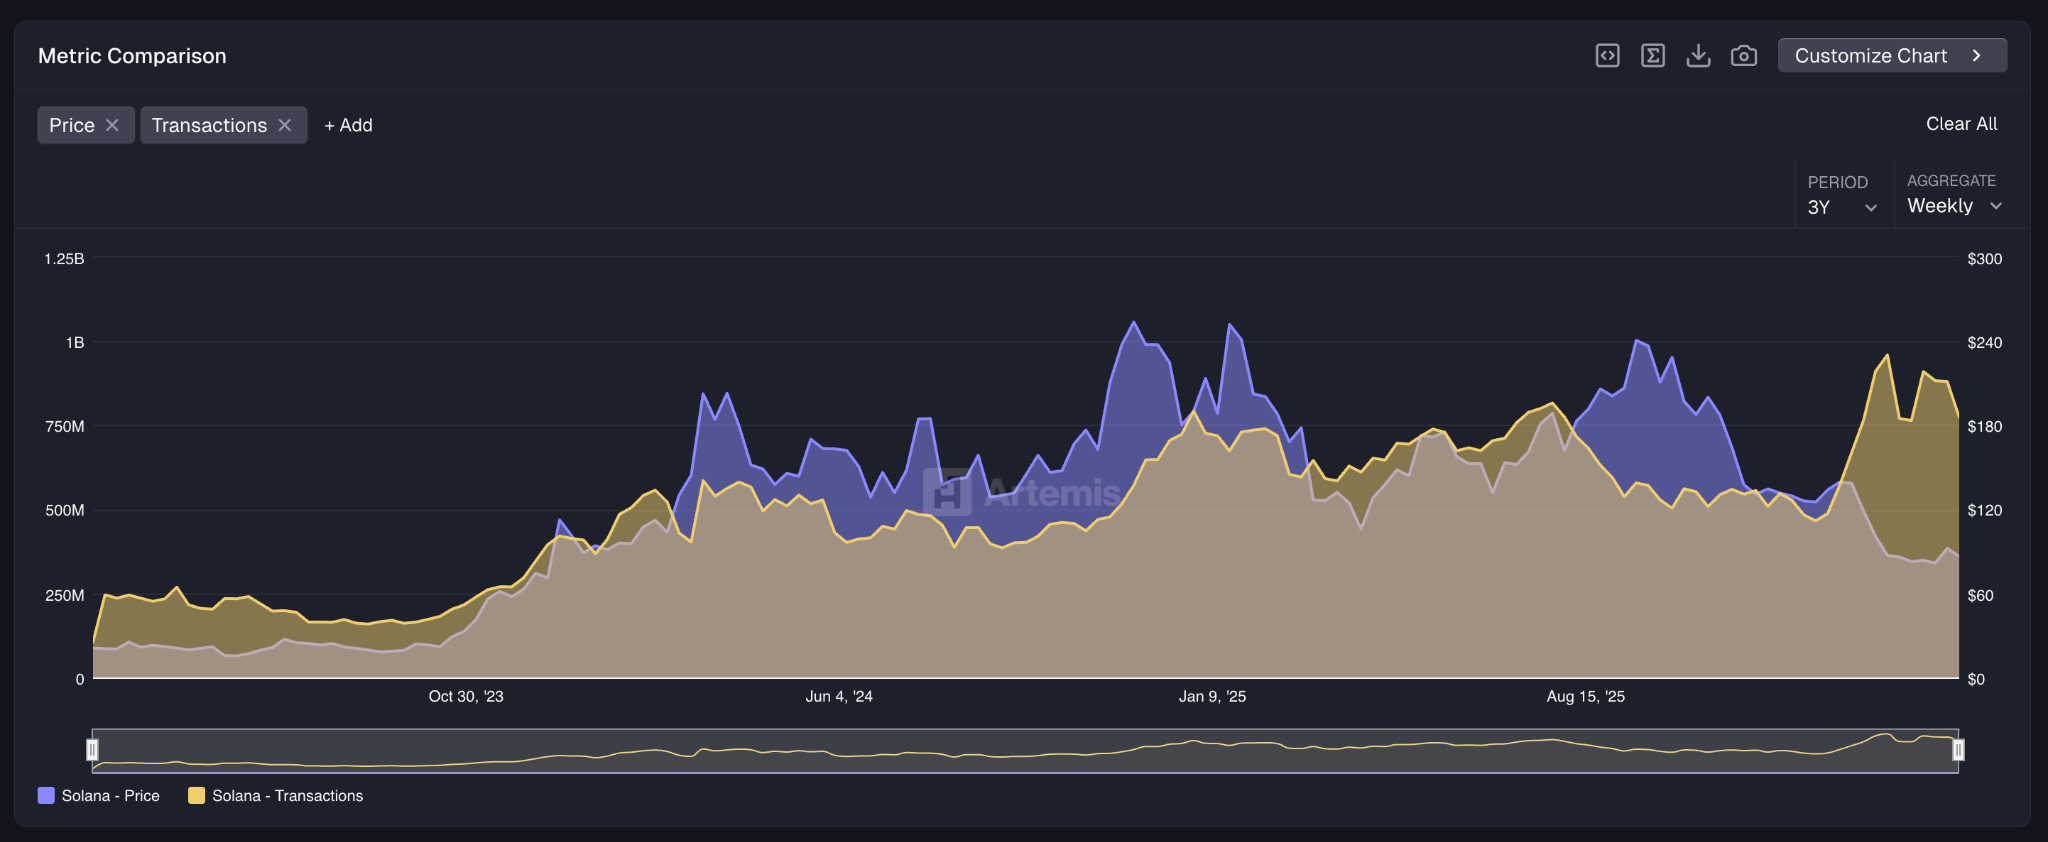
- Blockchain activity declined 20% from recent highs, indicating reduced network engagement.
- Market analyst Crypto Patel identifies a monthly bullish engulfing pattern as the critical indicator for potential explosive growth.
Solana continues to consolidate around the $90 threshold as market participants battle for control of this crucial price zone. The next several sessions may determine whether the asset advances higher or retreats to lower support levels.
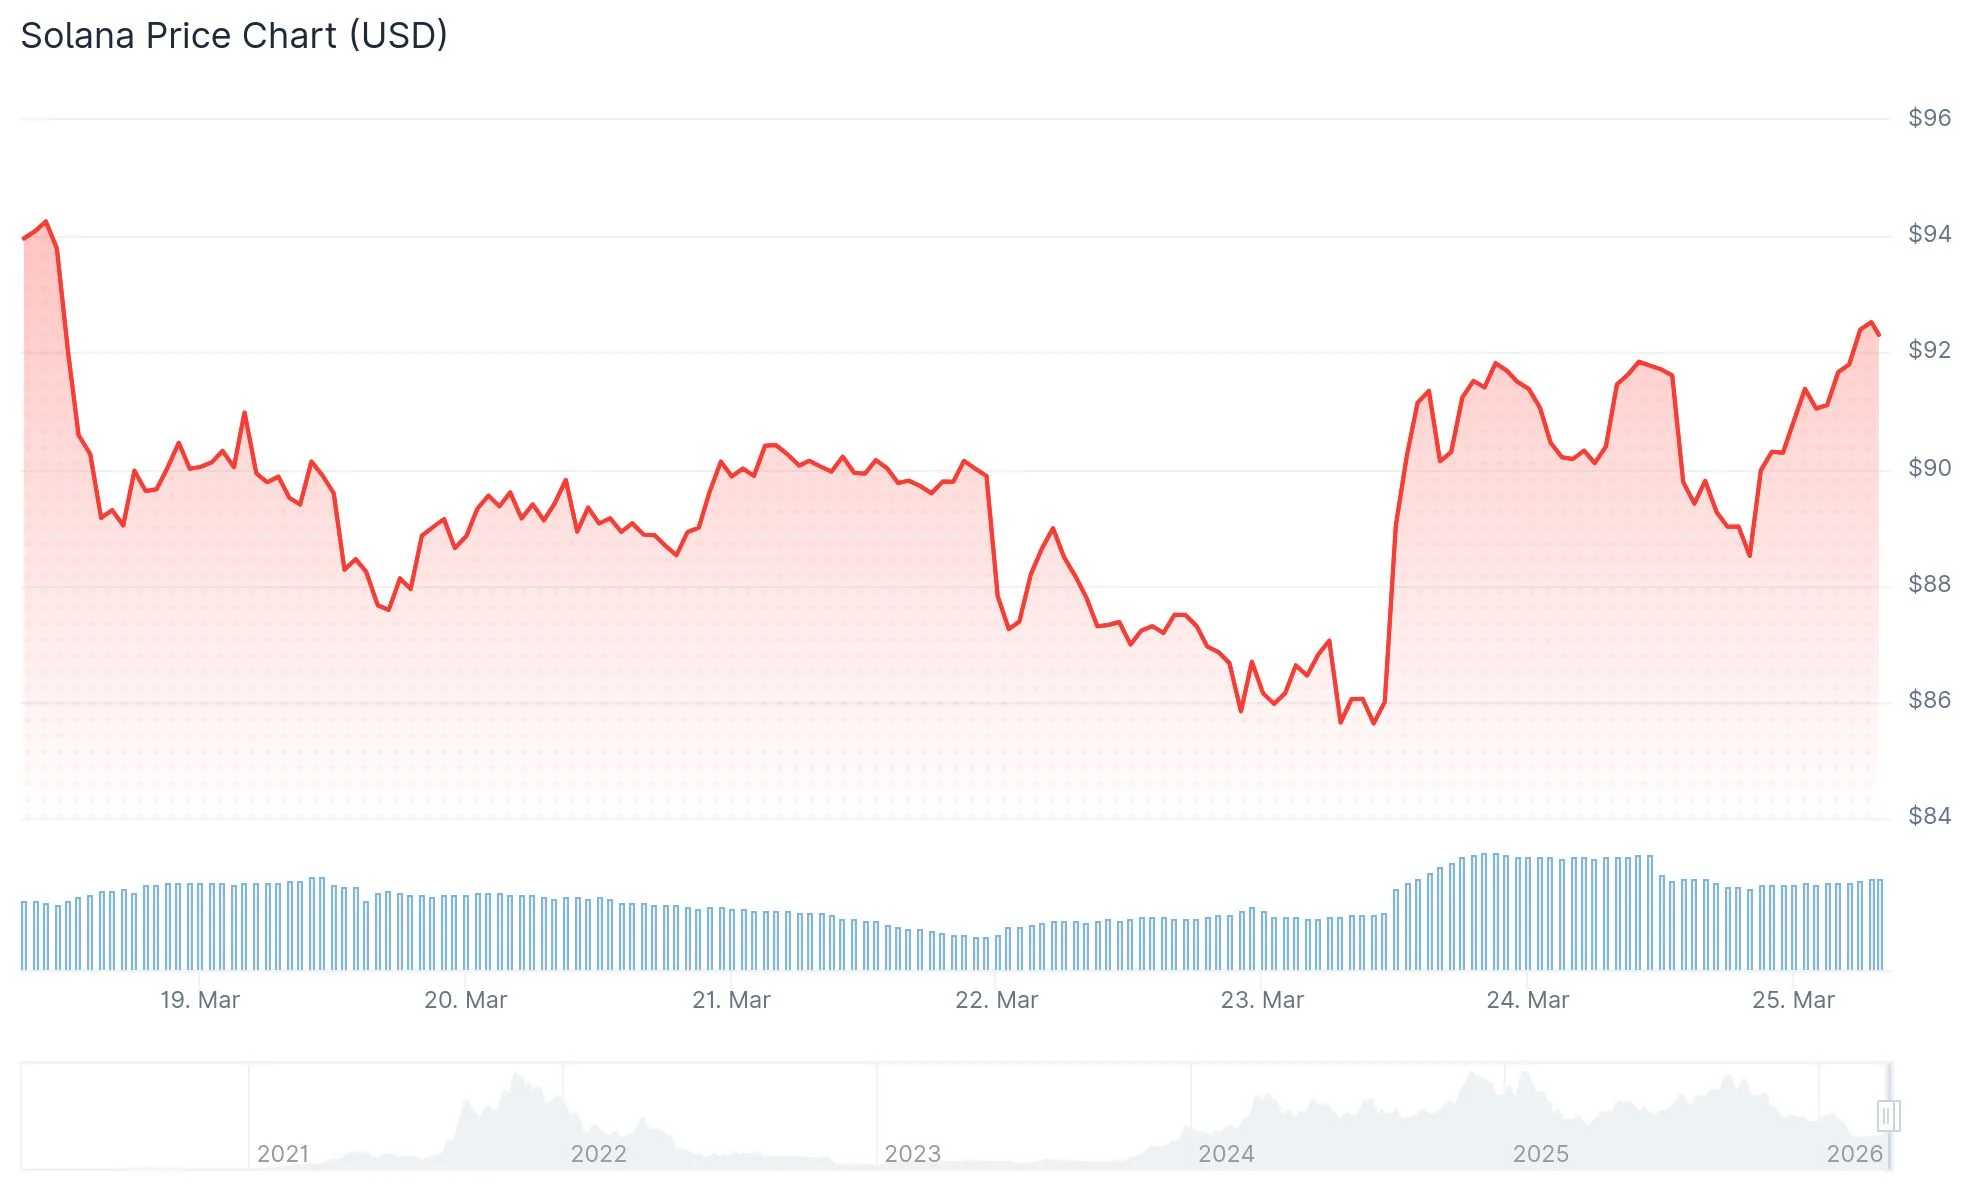
The token has appreciated roughly 7% during the past 30 days and currently trades just beneath the $90 resistance barrier. Market activity surged 30% throughout this timeframe, almost touching $5 billion, which represents approximately 10% of the circulating supply’s total valuation.
President Donald Trump’s announcement to halt American military operations against Iranian energy infrastructure provided a boost to digital asset markets this week. This development momentarily elevated SOL past $90, though profit-taking has prevented sustained momentum above this threshold.
Liquidation information reveals more than $370 million in bearish bets were eliminated during that temporary rally. Should buying momentum persist, additional short position closures could amplify upward movement.

The daily timeframe displays the Relative Strength Index (RSI) positioned at 54, following a brief climb beyond 60 last week. This indicates developing bullish momentum that hasn’t yet materialized into a confirmed breakout.
Critical Price Targets Under Observation
Should SOL decisively breach $90, the immediate objective becomes $100, representing an 11% advance. Continued strength beyond that milestone could drive the asset toward $120, delivering a 30% return from present values.
Analysis of the 4-hour timeframe reveals a buy indication emerged precisely as SOL tested $90, implying larger market participants are accumulating at this level. This reinforces the technical significance of the $90 price point.
Conversely, if downward pressure intensifies, SOL may retreat to $85 or potentially $80. The magnitude of bearish momentum would dictate the depth of any correction.
Blockchain Metrics and Monthly Technical Setup
Blockchain analytics from Artemis indicate total Solana transactions reached 774 million last week. This represents a 20% decrease from the latest peak, reflecting diminished network utilization.
The Fear and Greed Index has rebounded from an extreme low of 5 to 46, demonstrating investors are transitioning away from panic territory, although sentiment remains neutral to cautious.
Examining the monthly chart, analyst Crypto Patel has identified a noteworthy formation. He observes that each significant SOL bull run has begun with a monthly bullish engulfing candlestick pattern.
Historical instances include Solana climbing from $1.03 to $260 throughout 2020 and advancing from $8 to $296 in 2022. Patel suggests a comparable formation in 2026 could propel SOL toward $1,000 or higher.
Present technical metrics present a mixed picture. The monthly RSI registers 35.44, and SOL trades beneath all significant moving averages, including thresholds at $104, $111, $152, and $160.
The MACD indicator stands at -1.26, positioned below the signal line at -20.88, accompanied by a negative histogram, indicating ongoing near-term headwinds.
Currently, SOL changes hands at $89.33, featuring a 24-hour trading volume of $6.95 billion and a total market capitalization of $51.64 billion.