
 Bounces From Key Support as ETF Continues Attracting Capital")
TLDR
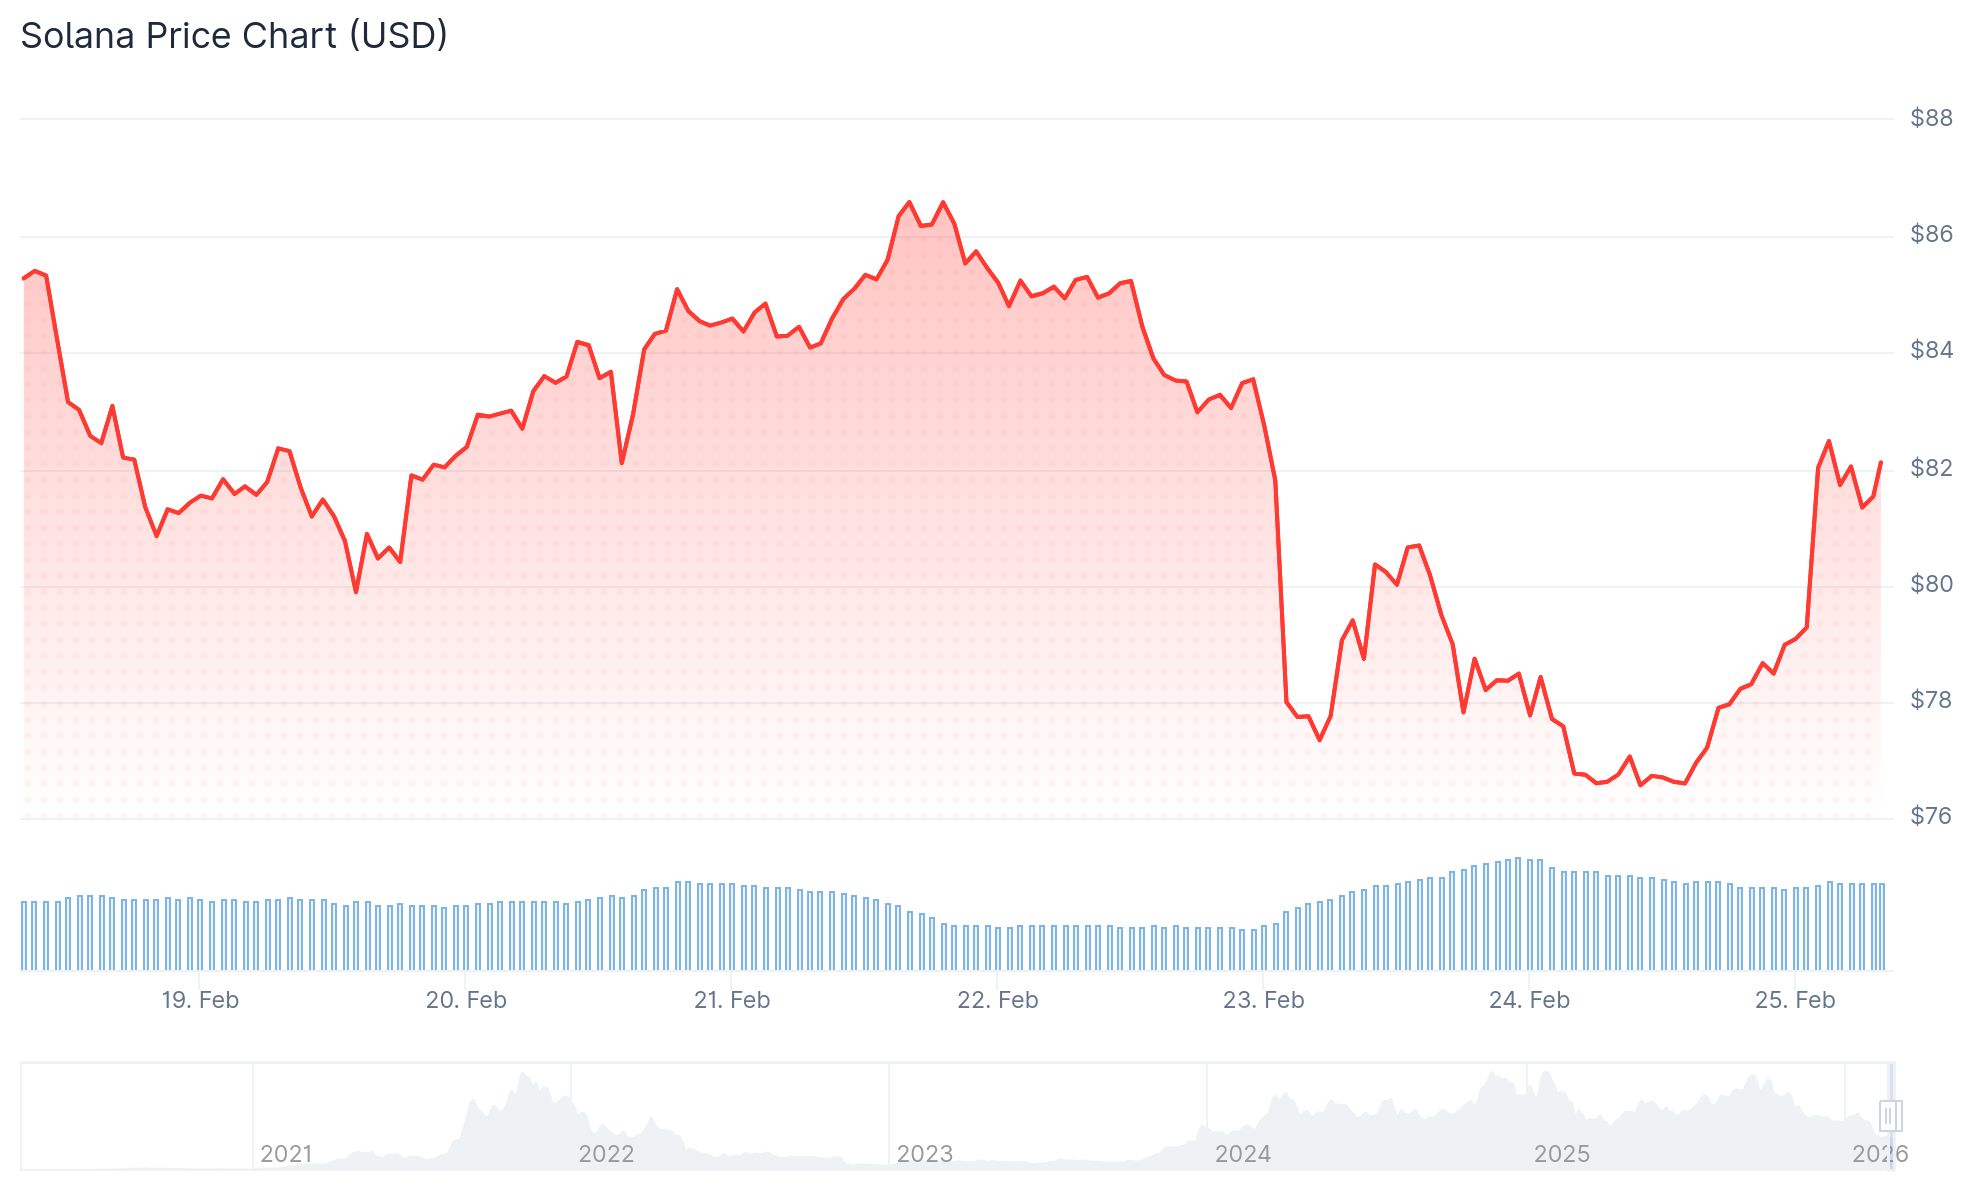
- Solana (SOL) currently hovers near $80 following a rebound from $75.64
- Technical indicators show a swing failure pattern (SFP) developing at the 0.618 Fibonacci support zone, hinting at possible reversal momentum
- Important resistance barriers include $82, $84, and $85, while extended targets sit at $92 and $95
- Bulls must successfully defend the $78–$82 range to validate any upward momentum
- Bitwise’s BSOL staking ETF attracted more than $3 million in net flows on February 23, despite SOL declining approximately 41% over the past quarter
Solana is working to stage a comeback following its descent to $75.64. The altcoin has managed to climb back over the $80 threshold and currently trades above its 100-hourly simple moving average.
This bounce occurred after SOL successfully breached a descending trend line that had been acting as overhead resistance around $81 on the hourly timeframe.
The cryptocurrency also managed to surpass the 50% Fibonacci retracement measured from the decline between $86.68 and $75.64. This represents a cautiously optimistic signal for near-term momentum.
However, selling pressure remains evident around the $82.50 area, which corresponds with the 61.8% Fibonacci retracement. This zone represents the immediate challenge for bullish traders.

A textbook swing failure pattern (SFP) has materialized at the 0.618 Fibonacci support level. This technical formation occurs when price momentarily dips beneath a previous low, triggers stop-loss orders, then sharply rebounds.
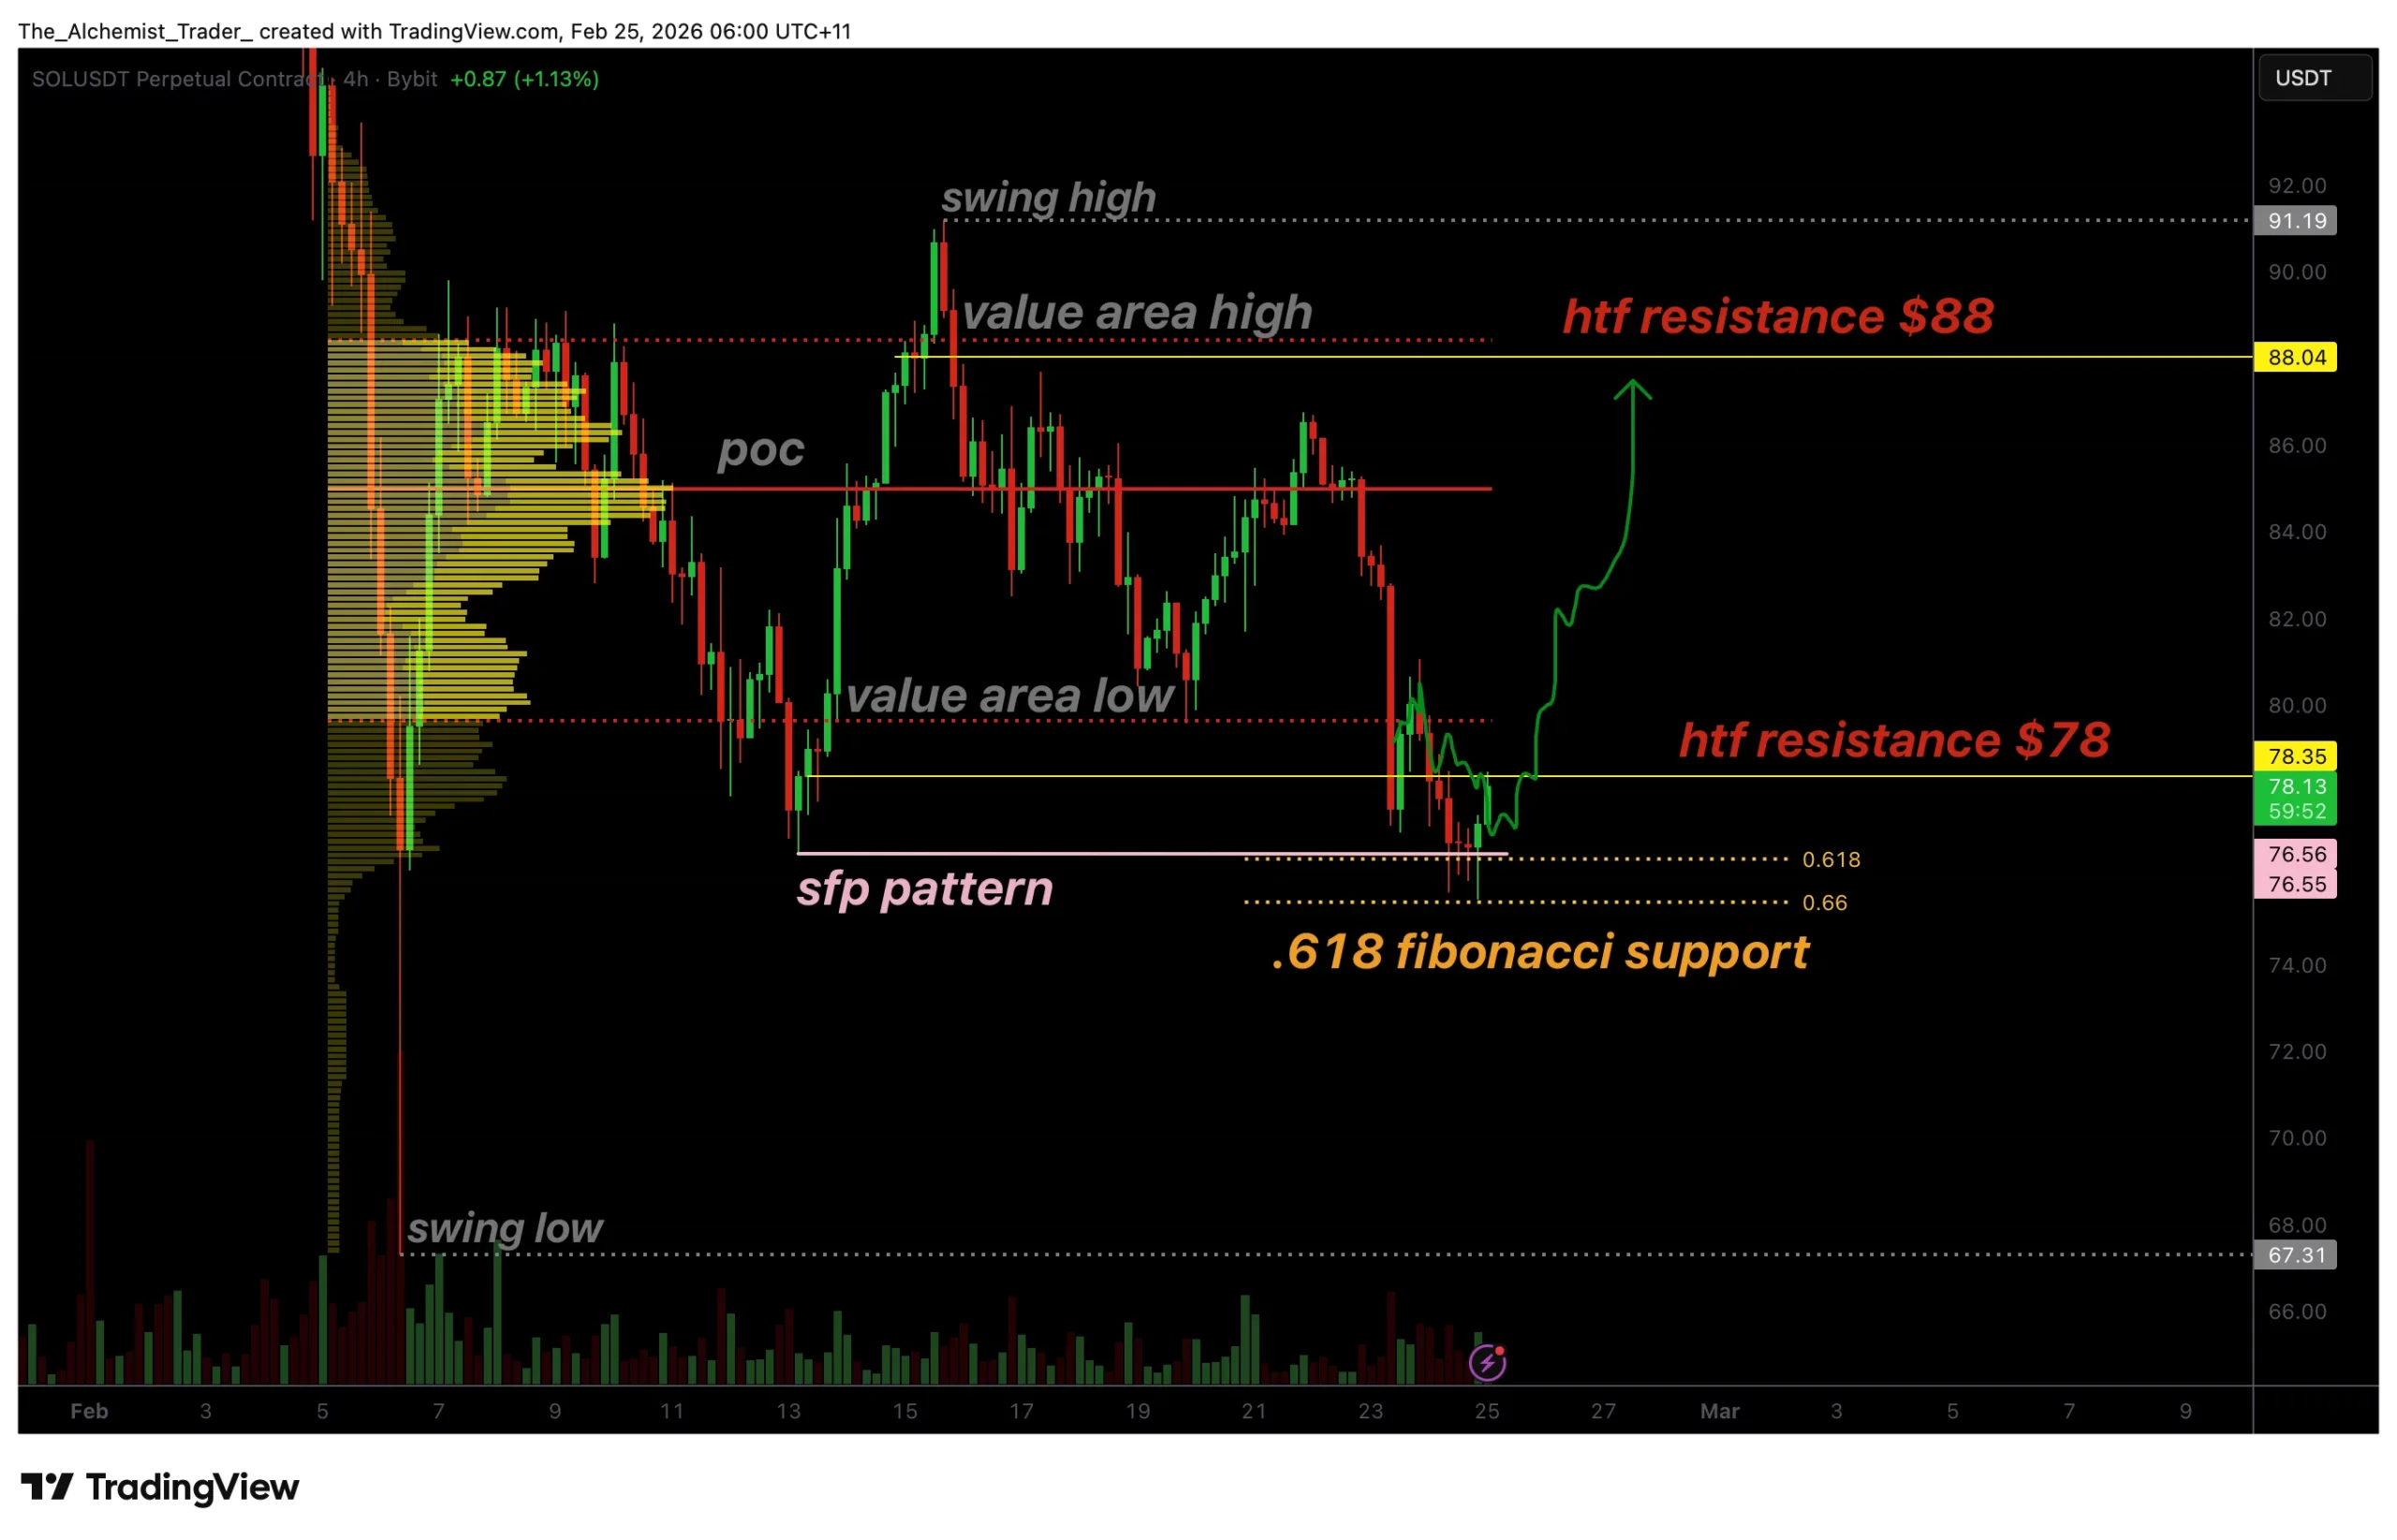
Several elongated lower wicks visible on the price chart demonstrate that bears attempted to drive prices lower but lacked follow-through. Purchasing demand emerged to counteract the downward momentum.
Traders often interpret this setup as evidence that a temporary floor may be establishing itself, although additional confirmation remains necessary.
$78 Is the Key Level to Watch
For this recovery attempt to gain legitimacy, SOL must recapture and maintain prices above $78. This threshold represents local resistance and serves as a pivotal inflection point for near-term trajectory.
Sustaining prices above $78 would also position SOL above the value area low, a metric employed in volume profile analysis to assess buyer commitment.
Should $78 prove durable as support, the subsequent bullish objective becomes $88. This level coincides with previous distribution areas and would mark a substantial recovery from present valuations.
Looking further ahead, resistance barriers emerge at $92 followed by $95. However, a decisive close above $85 would first be necessary to activate these higher targets.
BSOL ETF Sees Inflows Despite Price Drop
Regarding institutional activity, Bitwise’s Solana Staking ETF (BSOL) documented $3,048,570 in net capital inflows on February 23, 2026.
This addition elevates the fund’s total assets under management to $490,255,220. The daily inflow accounts for approximately 0.62% of total AUM.
This investment activity materialized even though SOL has declined roughly 41% during the preceding three-month period. Technical indicators for SOL-USD were displaying a Strong Sell signal during this timeframe.
Should SOL prove unable to clear the $82 barrier, immediate support zones are located at $80, followed by $79. A breakdown beneath $79 could redirect price action toward $77 or potentially $74.
SOL was changing hands at $76.57 when the BSOL inflow data was reported on February 23.