
 Stock: Record Leverage and Short Squeeze Potential Draw Trader Focus")
Key Takeaways
- Ethereum currently maintains position near $2,050, defending the crucial $2,000 psychological barrier
- Historic leverage ratio of 0.78 indicates unprecedented use of borrowed funds by market participants
- Approximately $273 million worth of short positions face liquidation risk near the $2,030 price point
- Weekly RSI indicator reads 33, hovering just above the 30 oversold threshold
- Critical price zones: upside resistance at $2,120, downside support at $1,930
The second-largest cryptocurrency has remained trapped in a narrow trading corridor for several weeks, with the struggle around $2,000 now capturing significant market interest. Given unprecedented leverage levels combined with substantial short positioning overhead, any breakout could prove volatile.

Ethereum is presently changing hands around $2,050 following its rebound from Sunday’s low near $1,908. The digital asset briefly attempted to break above $2,150 during the previous week before retreating.
Derivative market information from CryptoQuant reveals a net deposit of 110,343 ETH into derivative platforms on March 7. This represented the third-most significant influx recorded in 2026.
A comparable surge occurred on February 6, immediately preceding a roughly 13% rally from ETH’s annual bottom at $1,736. This historical pattern adds context to current market positioning.

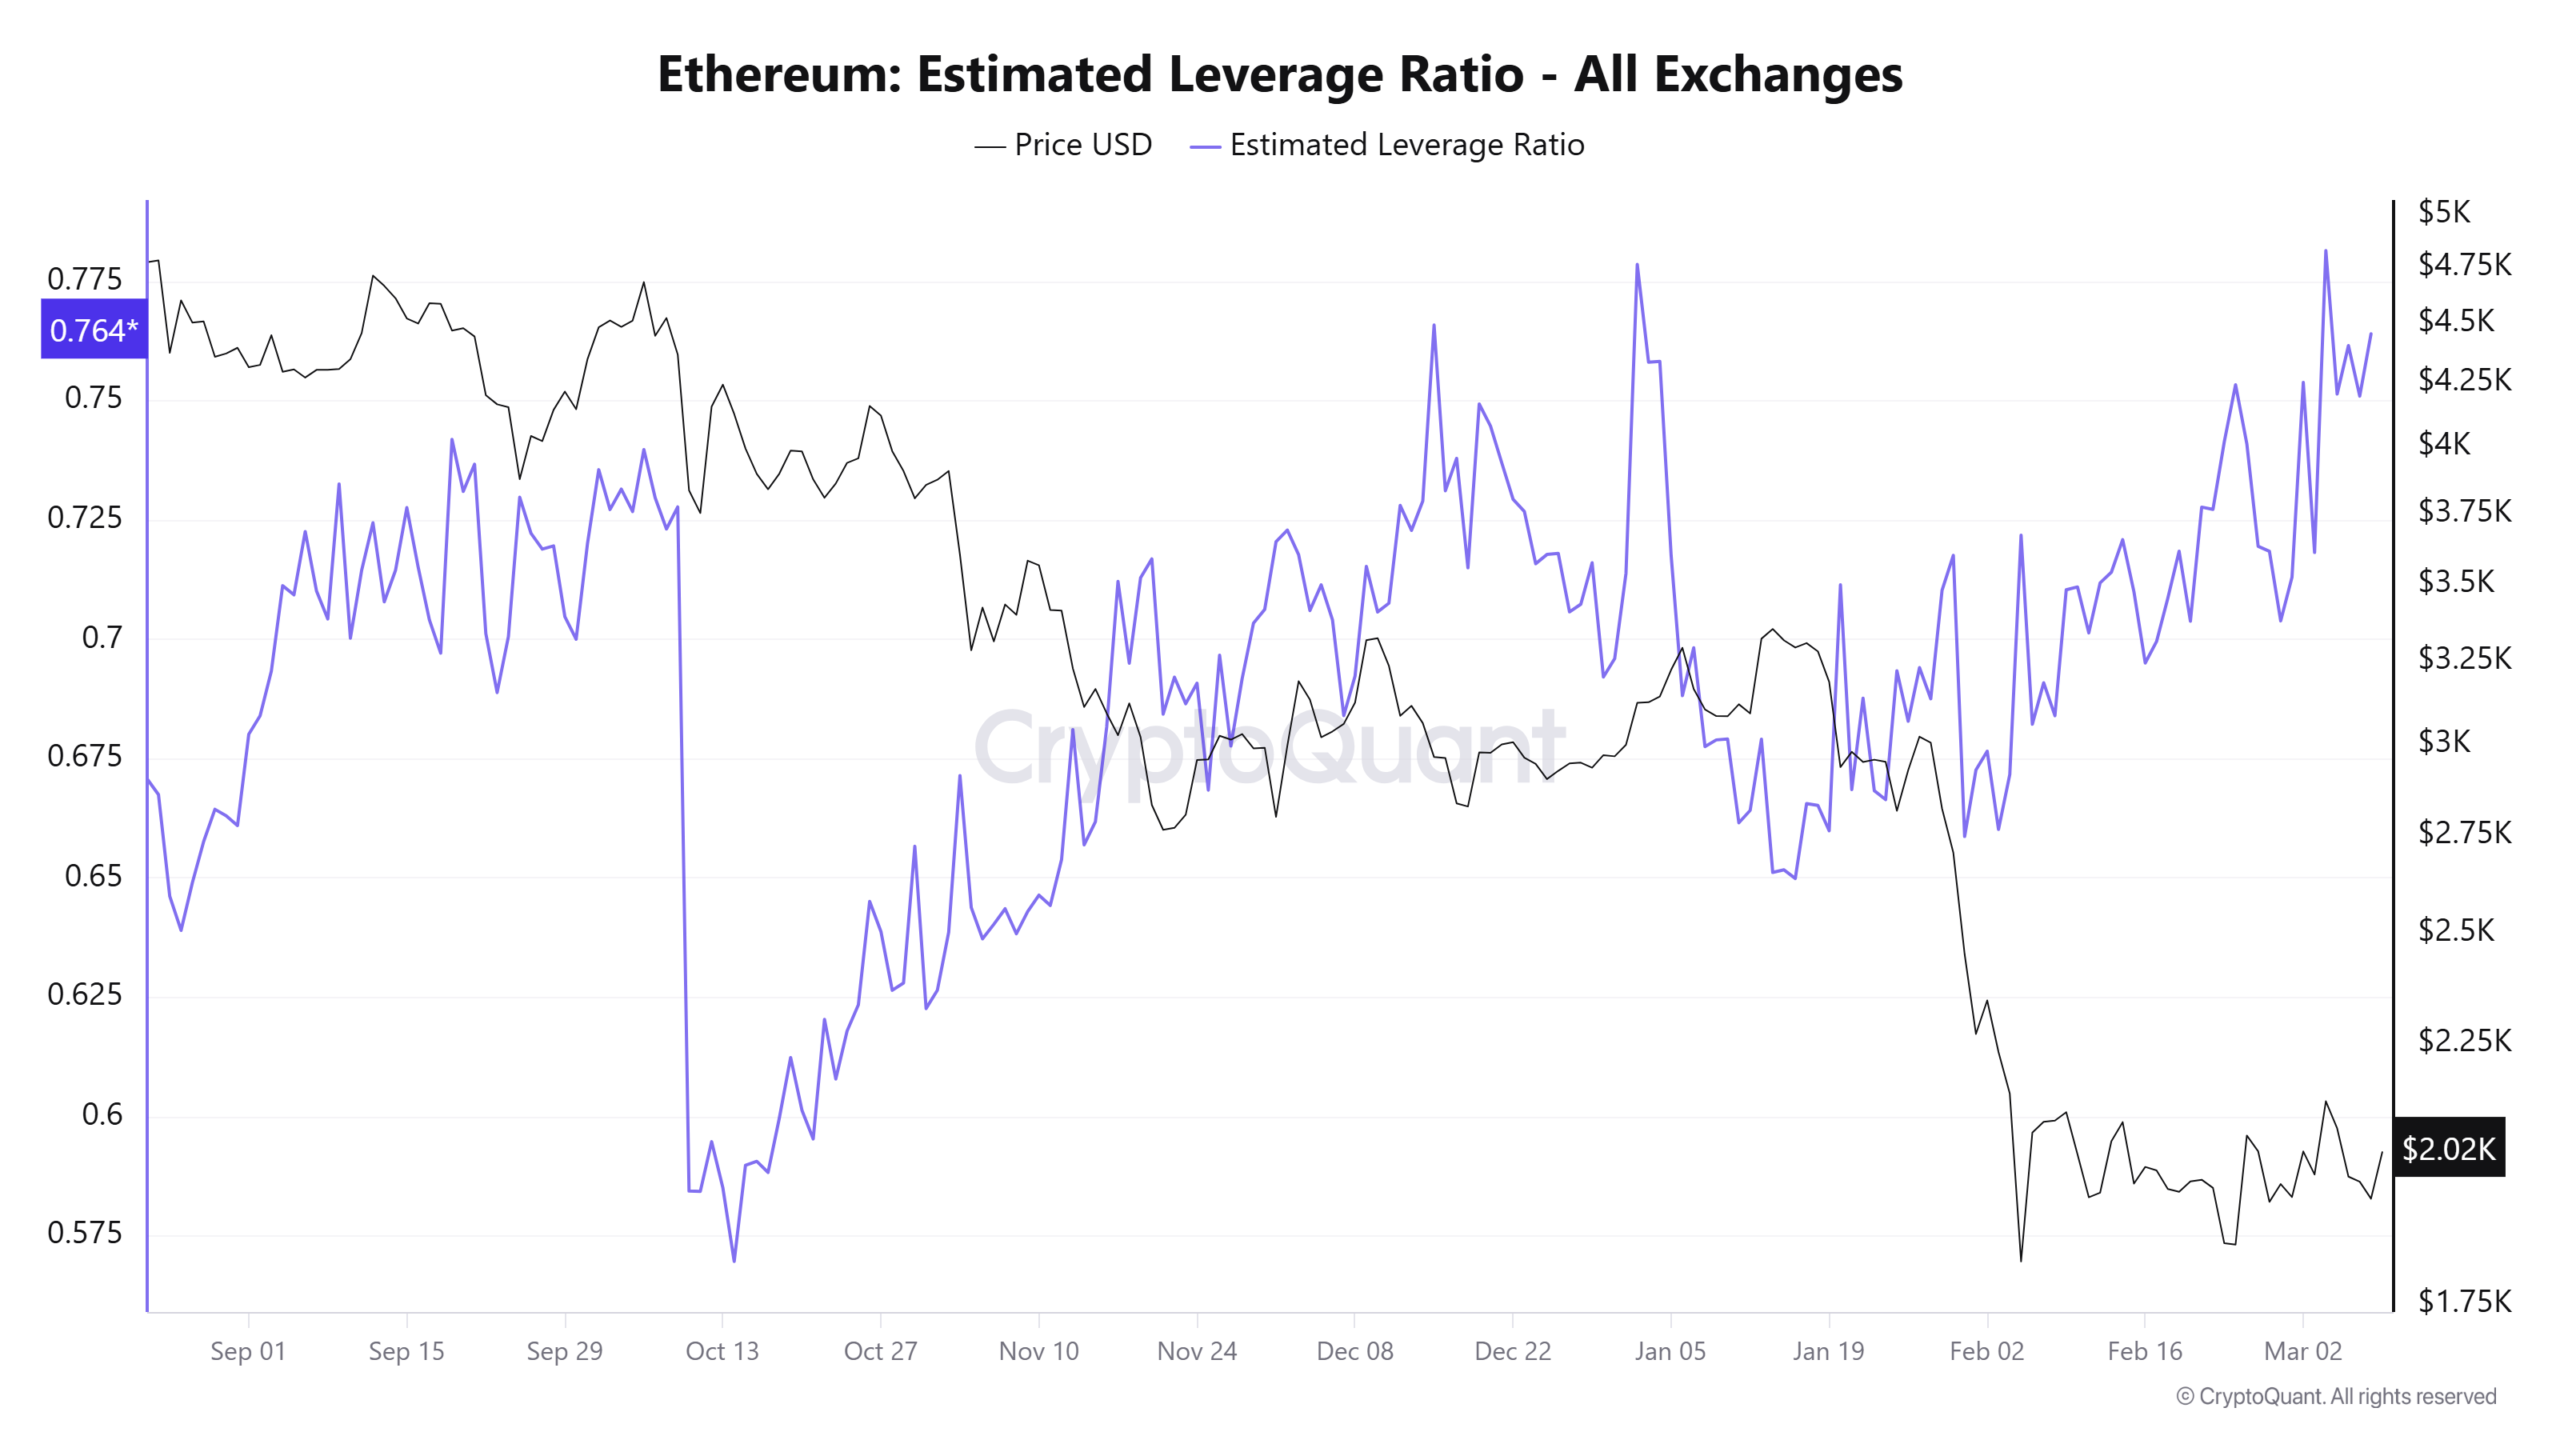
The estimated leverage ratio for Ethereum reached an unprecedented 0.78 during the current week. This surpasses the prior peak of 0.778 established on January 1.
This metric compares open interest against reserves held on exchanges. Elevated readings indicate greater reliance on borrowed capital, potentially amplifying price volatility in both directions.
Liquidation Clusters May Trigger Upward Momentum
According to CoinGlass analytics, approximately $273 million in short position liquidation exposure exists near the $2,030 price level. Such concentrations frequently serve as magnetic price zones.
Should Ethereum advance into this territory, mandatory short covering could rapidly intensify buying pressure. Market observers characterize this phenomenon as a “liquidity grab.”
Cryptocurrency analyst Cyril-DeFi observed that ETH is currently challenging a long-duration ascending support line that has remained intact since the previous bull cycle. According to the analyst, the $1,900–$2,000 region represents a pivotal zone that may determine subsequent directional bias.
Technical Indicators Signal Potential Reversal Zone
The weekly Relative Strength Index registers 33, positioned narrowly above the 30 oversold boundary. Historical analysis suggests readings within this territory have frequently preceded significant rebounds or accumulation phases.
The Fear & Greed Index currently stands at 13 out of 100, indicating “Extreme Fear” conditions. Such sentiment extremes have occasionally foreshadowed trend reversals.
Daily chart analysis shows Ethereum oscillating within a $1,930 to $2,050 range. Neither boundary has experienced a definitive breach.
A sustained daily close exceeding $2,120 would negate the current near-term bearish structure and potentially drive prices toward the $2,200–$2,350 corridor. The 20-day exponential moving average currently resides near $2,120.
Conversely, a breakdown below $1,930 would bring $1,760 into focus as the subsequent likely target, with $1,470 representing deeper support established during April 2025.
Twenty-four-hour trading volume for Ethereum totaled $22.4 billion. While selling pressure has diminished, substantial buying conviction has yet to materialize.
Recent price behavior demonstrates ETH maintaining ground above $2,000 with a bullish structural pivot developing on shorter timeframes following Sunday’s liquidity extraction near $1,908.