
 Stock: Critical Undervaluation Indicator Emerges—Previous Signal Led to 100% Surge")
Key Takeaways
- Ethereum has climbed 6.5% over the last 30 days, surpassing both Bitcoin and XRP performance
- Critical macro oscillator has dropped to -2.42, marking ETH’s entry into a historically undervalued territory last observed in 2022
- MVRV Ratio improved from -42% in February to current -27.5%, mirroring previous cycle bottom behavior
- April’s spot cumulative volume delta reached 184,500 ETH, indicating genuine buying pressure rather than leveraged speculation
- Critical resistance levels established at $2,225–$2,265, with potential upside targets extending to $2,400–$2,500 if $2,140 support maintains
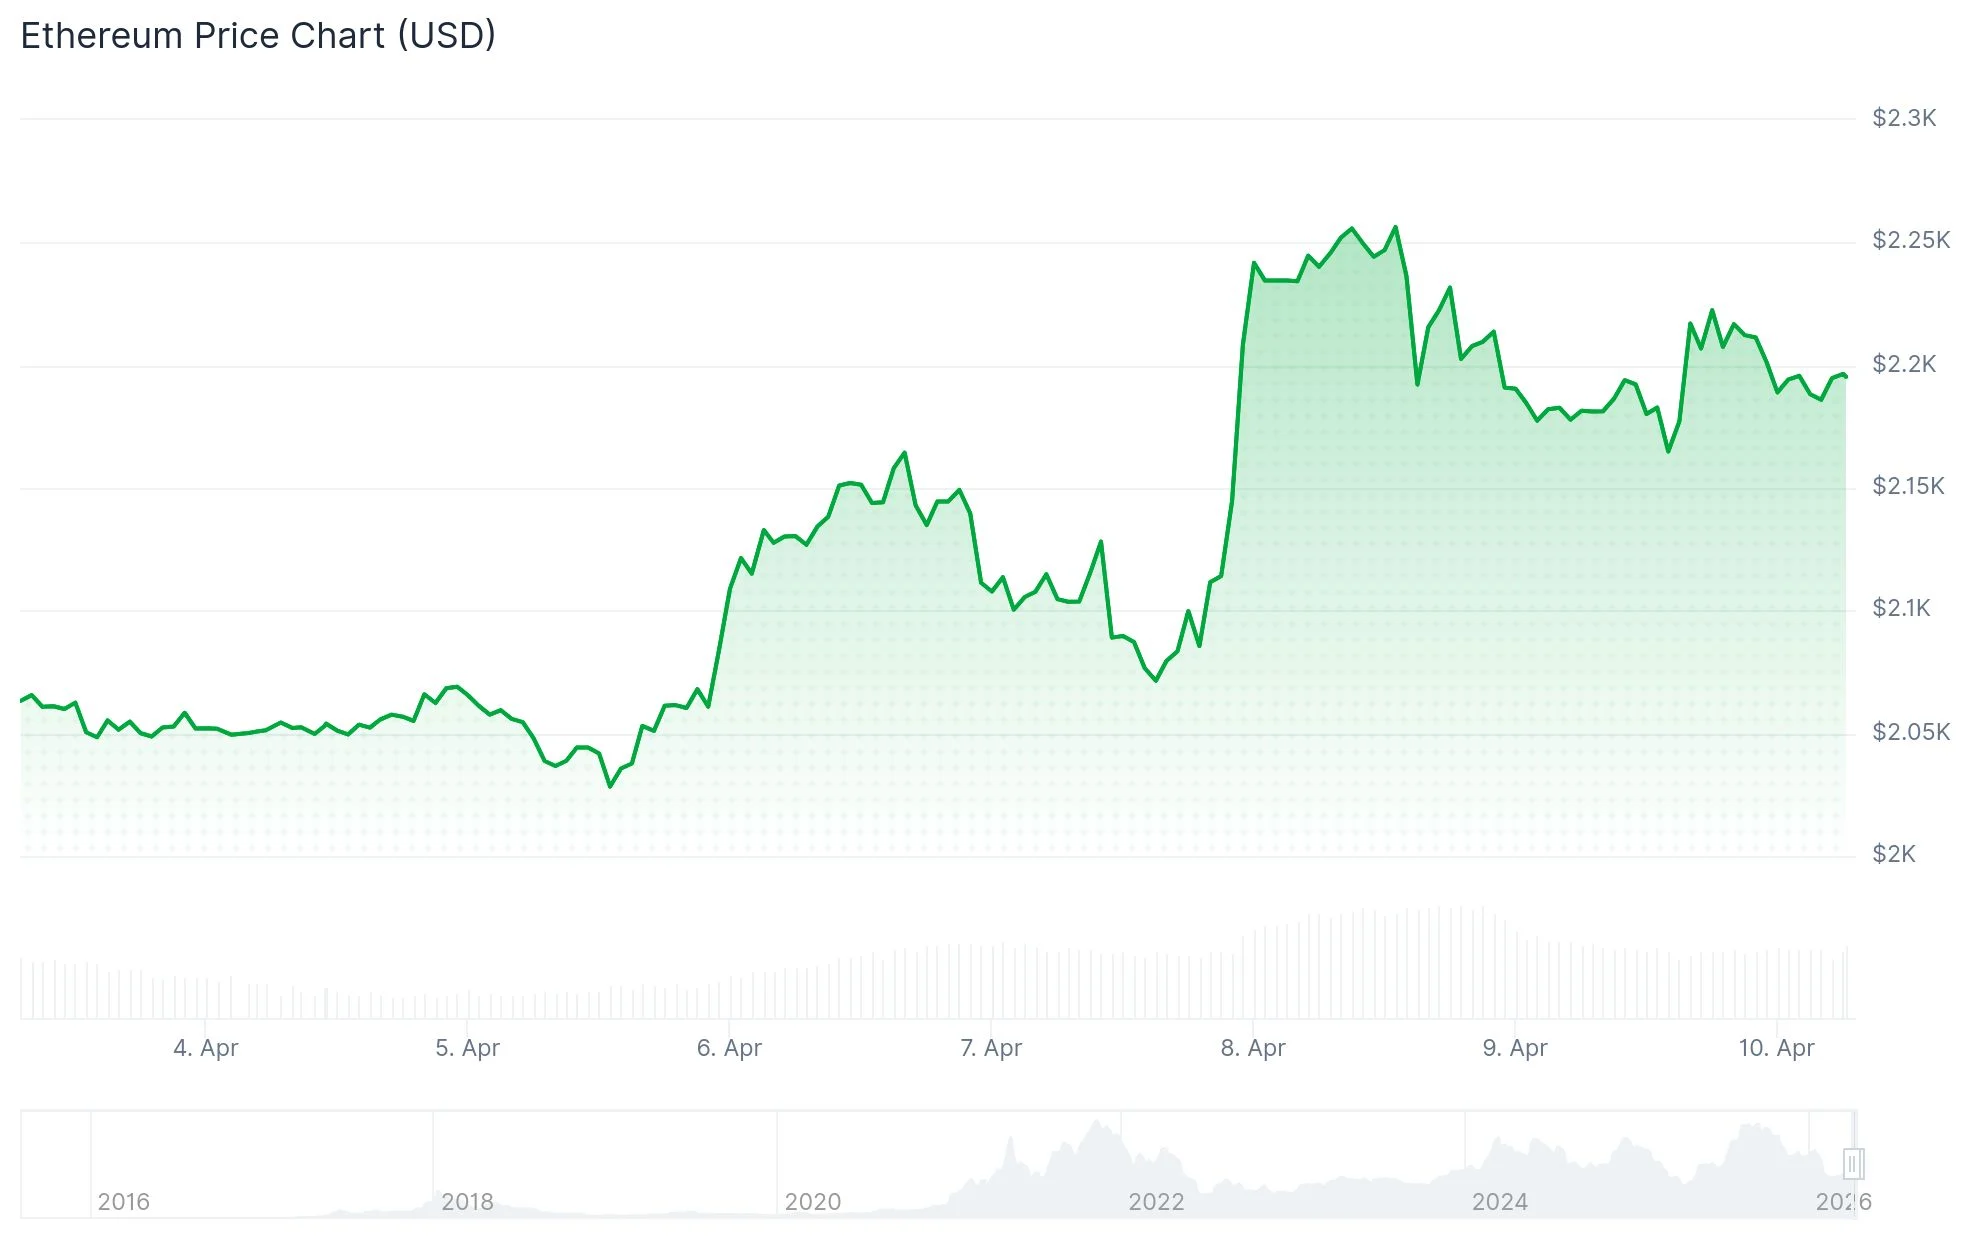
Ethereum has established trading above the $2,200 threshold following a 6.33% surge that propelled it beyond the $2,150 resistance barrier. Market participants are now eyeing a potential retest of the March peak around $2,385.
Across the previous month, ETH has emerged as the leading performer within the top five digital assets, registering a 6.5% increase. During this same timeframe, Bitcoin managed only a 1.4% gain, while XRP experienced a 4.7% decline.
The broader cryptocurrency sector received a significant lift following President Donald Trump’s announcement of a ceasefire agreement with Iran. Oil valuations, which had surged to $117 per barrel, retreated below the $100 threshold shortly thereafter. The Crypto Fear and Greed Index shifted from 23 (Fear territory) to a neutral stance at 47.
ETF capital flows turned positive but remained subdued. Only $36 million entered the market throughout the initial three trading sessions of the week.

Critical Macro Indicator Signals Undervaluation Territory
The Capriole Macro Index Oscillator currently registers -2.42 for ETH, marking a depth not witnessed since 2022. This indicator synthesizes investment patterns, cycle dynamics, and blockchain data. Significantly negative measurements have historically corresponded with seller fatigue and subsequent price rebounds.
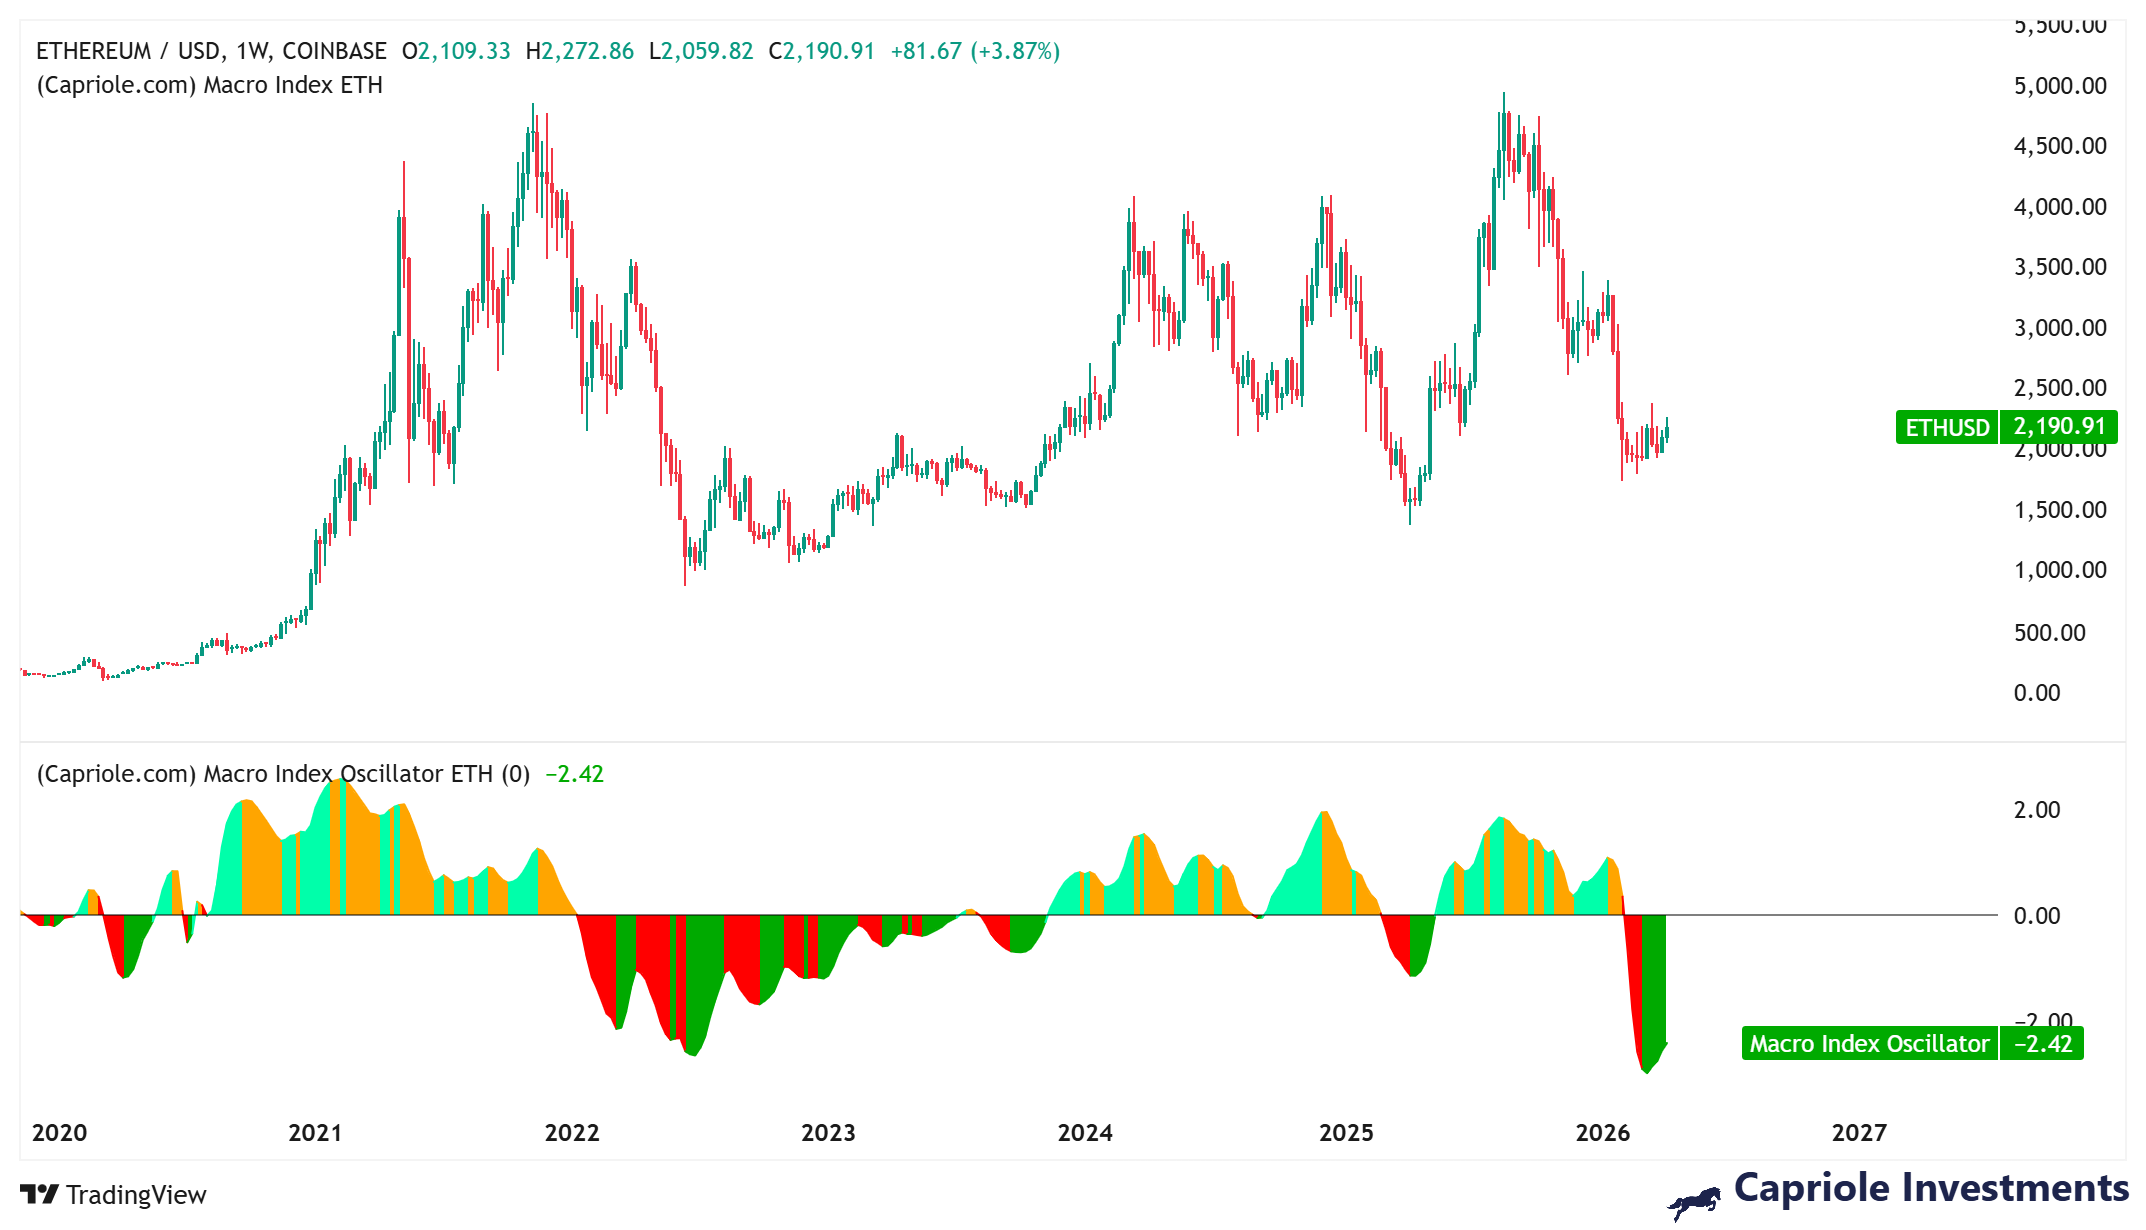
During mid-2022, ETH established a bottom around $1,000–$1,200 when this metric descended to -2.2. In the closing months of 2023, a decline to -1 preceded ETH’s breakout from the $1,500 level.
MVRV Metric Demonstrates Recovery Trajectory
The MVRV Ratio, which measures current market capitalization against the aggregate cost basis of all holders, plummeted to -42% during early February. Since then, it has rebounded to -27.5%. This progression closely resembles the pattern observed in April 2025, when ETH established a floor near $1,400 before initiating a substantial rally.
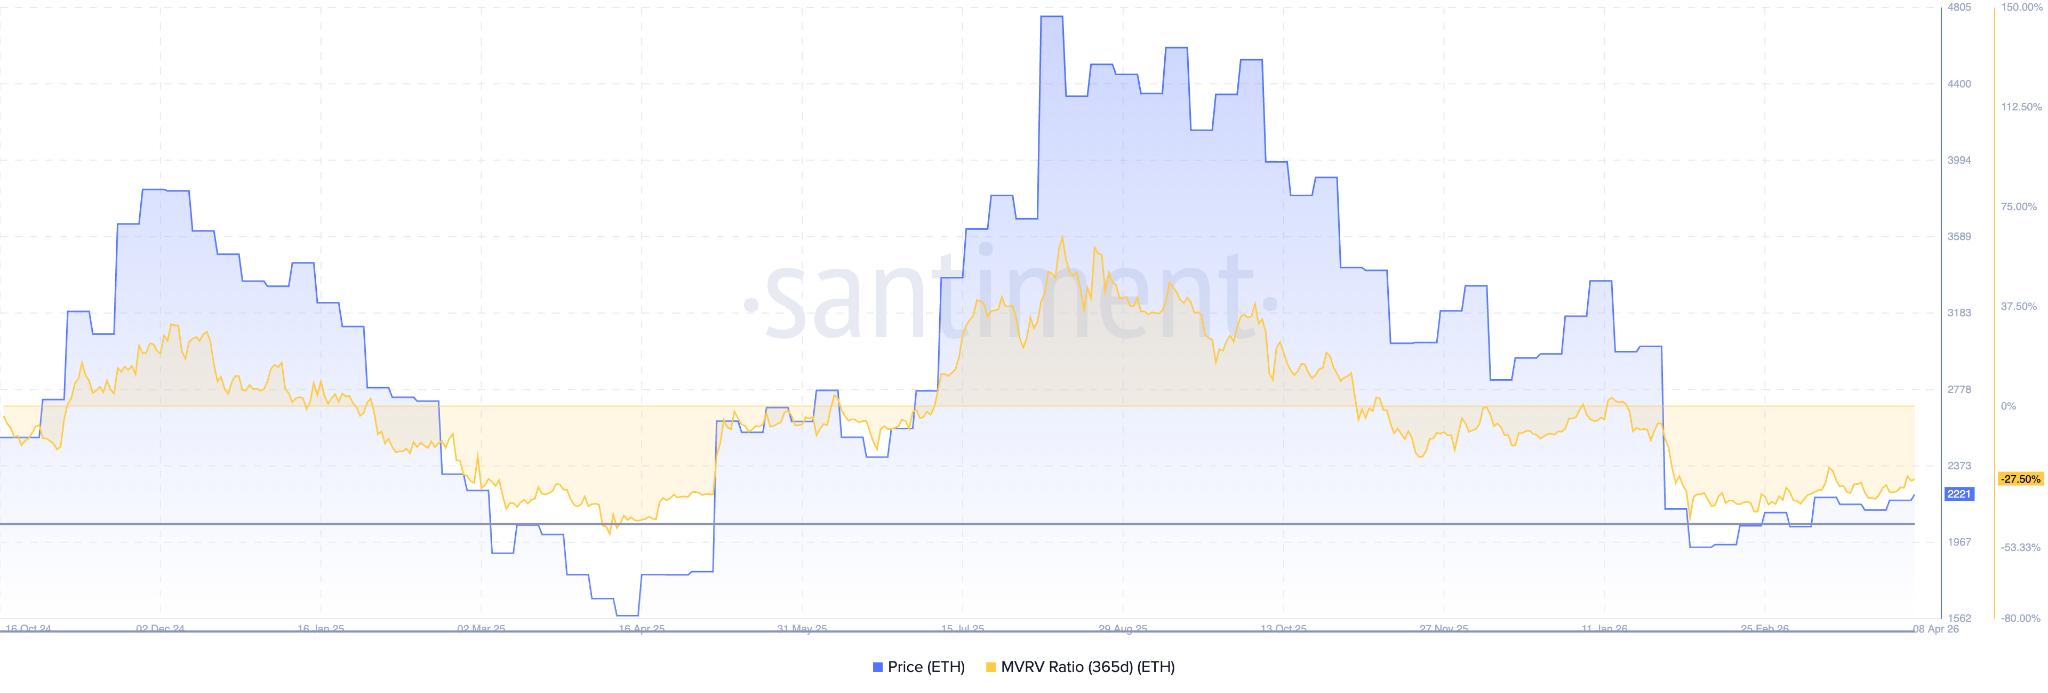
The previous instance when the MVRV Ratio crossed back into positive territory, ETH delivered a 70% appreciation over a two-month period.
Analyst crypto sunmoon observed that Ethereum’s taker buy/sell ratio has maintained an upward trajectory for approximately four to five months. The analyst highlighted that this configuration bears striking resemblance to the setup preceding the April–May 2025 rally.
Genuine spot market demand is fueling the current momentum. The aggregated spot CVD registers at 184,500 ETH for April. Futures CVD has similarly ascended progressively to 4.36 million ETH. The funding rate maintains a positive stance at 0.0052, while open interest hovers near 4.75 million ETH — trading within a defined range, suggesting limited leveraged positioning in the marketplace.
Analyzing the four-hour timeframe, ETH has constructed a series of ascending lows. Immediate resistance materializes at $2,225, followed by $2,265. A decisive breach above $2,265 would clear the pathway toward $2,320 and potentially the $2,400–$2,450 zone.
Should ETH surrender the $2,140 threshold, preliminary support exists at $2,110, with the primary support foundation located near $2,060.