
 Triggers Rare Cycle Signal That Previously Sparked Massive Rallies")
TLDR
- Dogecoin slipped beneath the $0.10 threshold, touching $0.0909 on February 24, 2026
- DOGE remains under the 100-hour moving average with bearish resistance forming at $0.0958
- Critical resistance zones are positioned at $0.0958, $0.0975, and $0.10; support lies at $0.0910 and $0.0880
- A historical cycle metric reveals DOGE has traded above today’s levels for over 1,100 days in its past — an unprecedented occurrence
- Similar readings only materialized twice before: during the March 2020 crash and October 2023 bottom, both preceding significant rallies
Dogecoin tumbled through the psychologically significant $0.10 level on February 24, 2026, mirroring a widespread cryptocurrency market selloff that impacted Bitcoin and Ethereum as well.
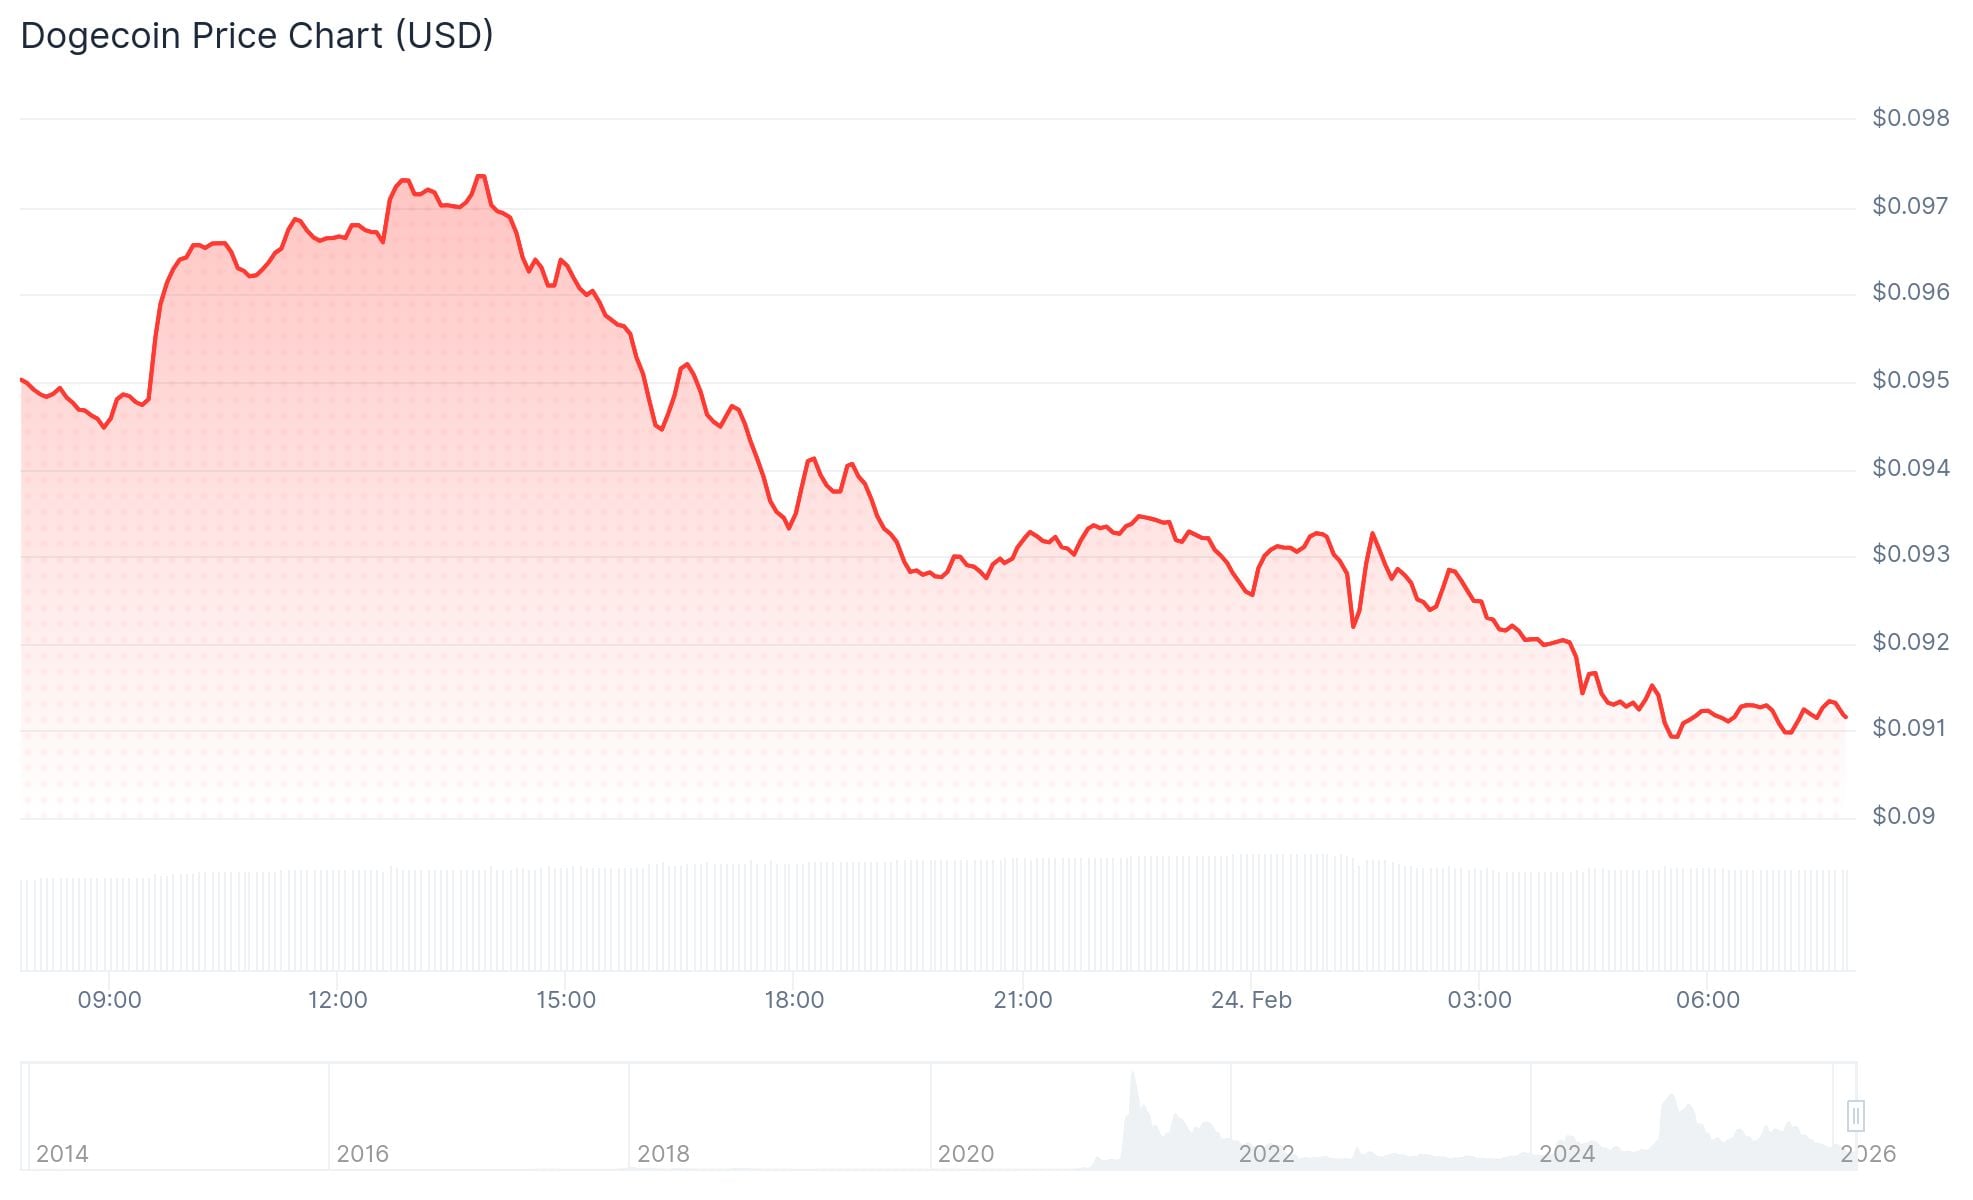
DOGE touched a session low of $0.0909 before managing a modest bounce. The meme coin is now consolidating below $0.0950, with no definitive signs of trend reversal emerging.
The cryptocurrency remains beneath its 100-hour simple moving average. Technical analysis reveals a bearish trend line developing on the hourly timeframe, creating resistance near $0.0958.
Buyers attempted to push prices beyond $0.0925, but momentum stalled below the 38.2% Fibonacci retracement level calculated from the recent decline spanning $0.0974 down to $0.0909.

For bullish momentum to return, DOGE must convincingly break above $0.0958 resistance, followed by $0.0975. Successfully clearing $0.0975 would target $0.10, with extended upside potential toward $0.1020.
Conversely, continued rejection at $0.0958 would expose support at $0.0910 and subsequently $0.0880. Losing the $0.0880 floor could accelerate selling toward $0.0832 or even $0.0820.
Unprecedented Reading on Long-Term Cycle Metric
Despite near-term bearish technicals, one particular long-duration indicator is capturing analyst attention.
Alphractal’s founder Joao Wedson shared on X that DOGE has surpassed 1,100 on his proprietary “Number of Days Spent at a Profit” indicator — marking the first occurrence in Dogecoin’s entire existence.
This indicator calculates how many historical trading days recorded prices above the current level. Elevated readings indicate the current price sits below a substantial portion of its lifetime trading history.
Prior to this milestone, DOGE only exceeded the 800-day mark on two occasions. Both instances coincided with significant market cycle bottoms — during the March 2020 pandemic crash and the October 2023 drawdown.
Previous Bottom Formations Led to Explosive Gains
Following the March 2020 capitulation, DOGE surged from approximately $0.0011 to a peak near $0.76 by November 2021 — representing an astronomical gain exceeding 65,000%.
After establishing the October 2023 low, DOGE appreciated roughly 750%, advancing from $0.0569 to $0.4846 by December 2024.
Wedson characterized the 1,100+ reading as “a structural cycle metric, not just a short-term move.”
He positioned it as regime-level intelligence about where current pricing stands relative to Dogecoin’s complete trading history.
As of February 24, DOGE continues consolidating below $0.0950 with bearish momentum persisting on intraday charts.