
 Stock Faces Continued Bearish Pressure Despite Promising PMI Signal")
TLDR
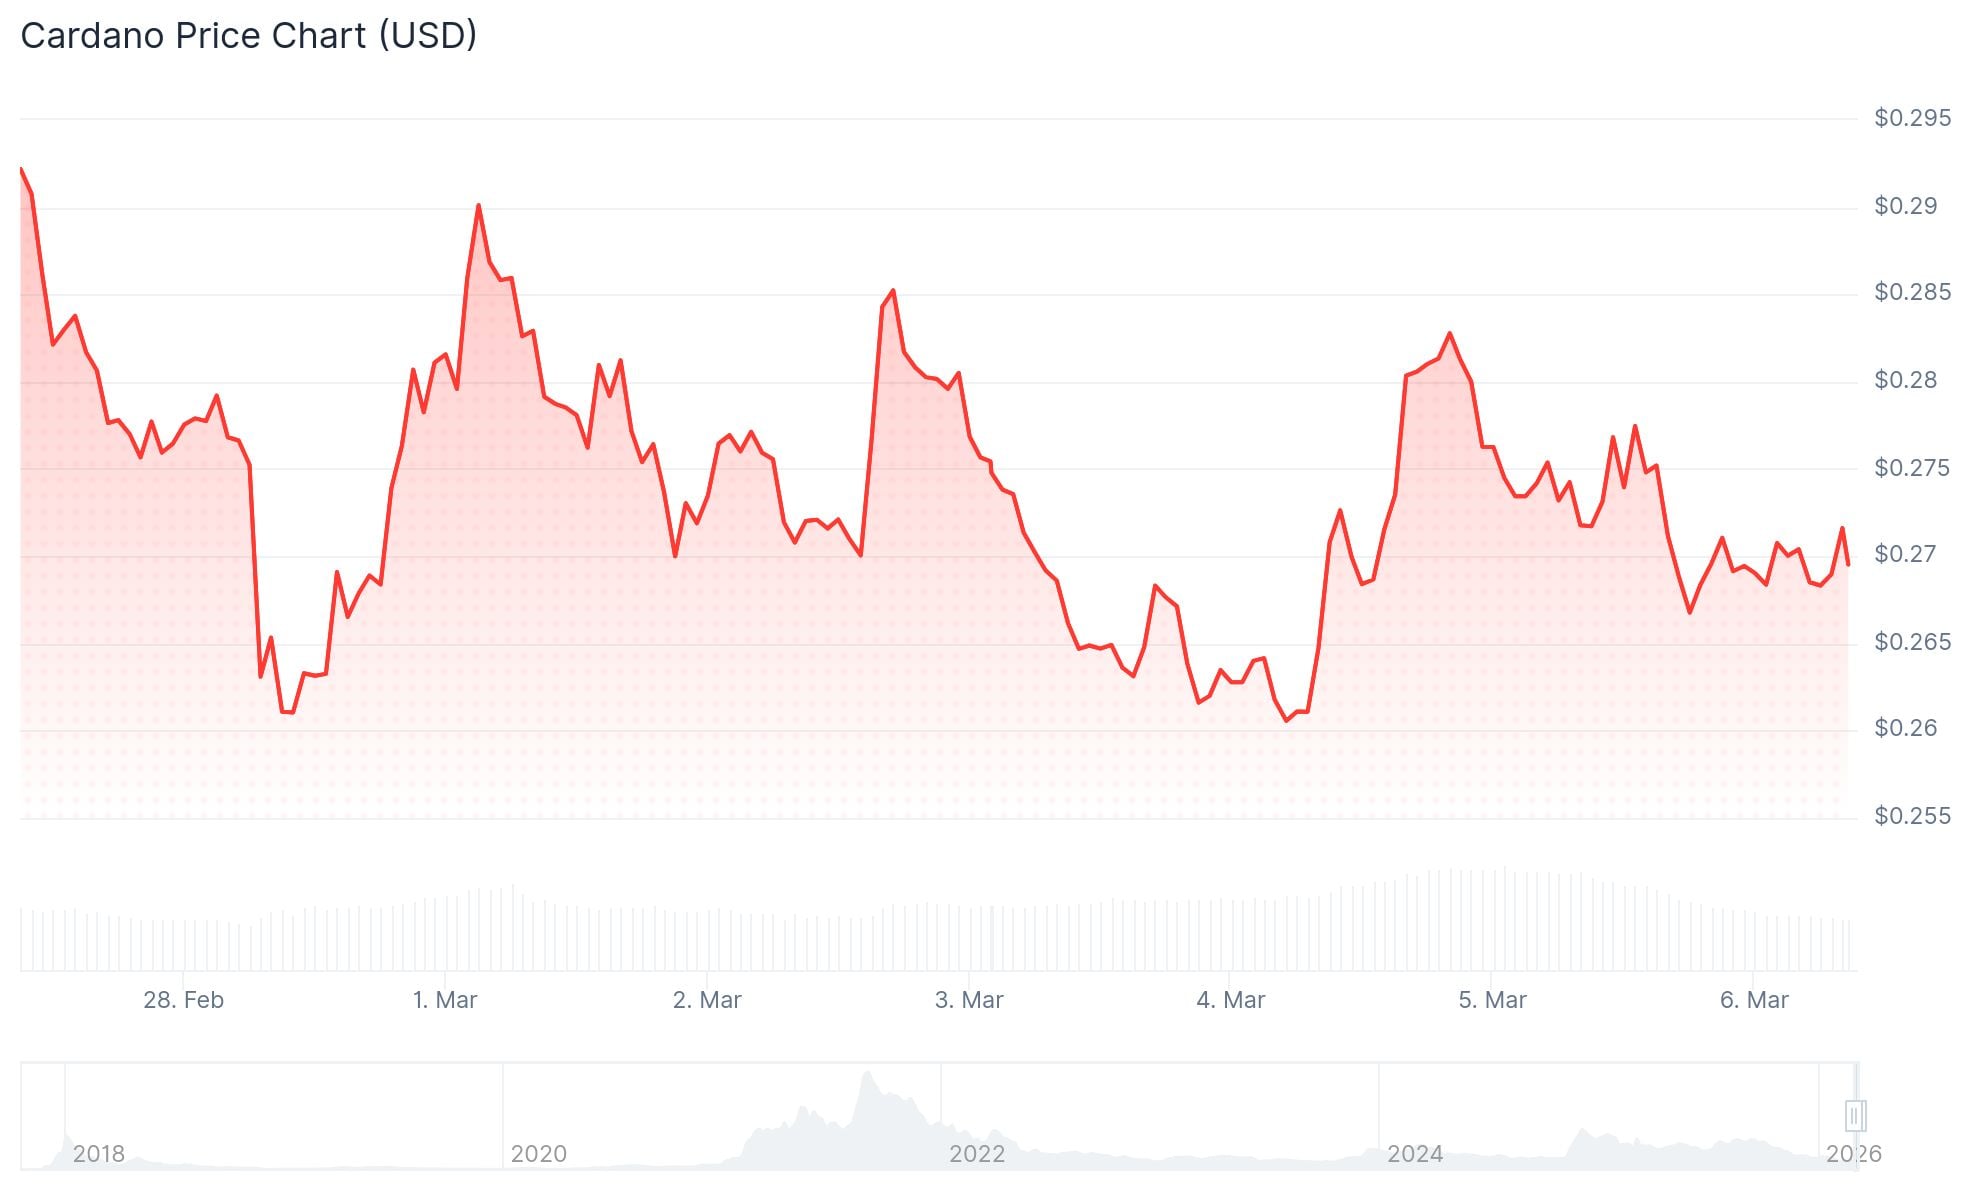
- Cardano is currently valued at approximately $0.27, nearing a critical downward trendline at $0.28 that has consistently served as a rejection point
- Futures open interest has declined to $462 million with a long-to-short ratio of 0.79, indicating prevailing bearish sentiment
- The token continues trading significantly beneath its 50-day and 100-day EMAs, both positioned above the $0.30 threshold
- With an RSI reading of 46, below the neutral 50 mark, momentum recovery remains subdued
- Manufacturing PMI has climbed to 52.4%, marking three consecutive monthly gains over a 40-month period—a pattern historically linked to ADA rallies
Cardano (ADA) continues to hover around the $0.27 level this Thursday, March 6, as the asset edges closer to a significant descending trendline situated near $0.28. This technical barrier has already pushed back price action in recent sessions and remains the primary obstacle for any near-term upward movement.
Futures market data reinforces the negative outlook. Open interest for Cardano has contracted to $462 million, experiencing a consistent decline since the middle of January.
When open interest decreases while price action remains stagnant or declines, it typically indicates trader disengagement and reduced market participation.
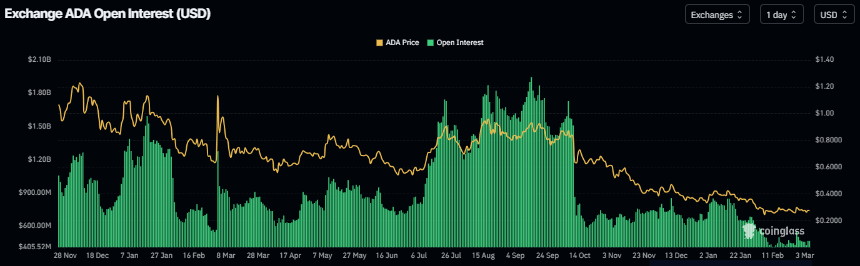
According to CoinGlass, the current long-to-short ratio measures 0.79. This figure represents one of the lowest readings witnessed in more than a month, revealing that short positions outnumber long positions—a clear sign of bearish positioning.

Cardano also remains substantially below both its 50-day and 100-day Exponential Moving Averages, which are clustered above the $0.30 mark. This separation underscores the dominant downtrend currently affecting the asset.
The daily Relative Strength Index registers at 46. Although this represents an improvement from oversold conditions, it stays beneath the 50 centerline, indicating momentum has yet to regain strength.
The MACD indicator shows marginally positive territory, though the histogram displays minimal movement. This configuration suggests consolidation behavior rather than a decisive trend change.
Key Price Levels to Watch
Looking at resistance, the immediate barrier stands at the trendline around $0.28. A more substantial resistance zone exists at $0.32, where descending EMAs also cluster.
A confirmed daily close above $0.32 would be necessary to invalidate the current bearish framework.
Support zones are identified at $0.26, with a secondary horizontal support level at $0.24. Should ADA breach the $0.24 threshold, additional downside potential would likely emerge.
Currently, ADA appears positioned to trade within a range bounded by $0.26 and $0.29 unless a significant catalyst emerges to drive price through resistance.
Macro Indicator Points to Possible Shift
Bitcoin’s recent climb above $73,000 to reach a one-month peak did not translate to similar gains for ADA. The token registered only modest appreciation and failed to secure a close above the prior day’s candlestick.
Crypto analyst Dan Gambardello has highlighted the manufacturing Purchasing Managers Index (PMI) as a critical indicator for Cardano’s future trajectory.
The PMI, which measures manufacturing sector vitality, currently registers at 52.4%. This represents the third straight monthly advance over a 40-month timeframe.
Gambardello observes that previous PMI expansion cycles have historically coincided with bullish price movements for ADA.
The present situation also draws parallels to the 2019 correction period, during which ADA experienced red monthly candles in six out of seven months before initiating a strong recovery.
Quantitative tightening concluded in December 2025. According to Gambardello, this development paired with an ascending PMI creates a macro environment similar to conditions that preceded Cardano’s previous significant price rally.
Cardano has now recorded six consecutive monthly red candles after closing February in negative territory.