
 Stock Slips Under $71K Following US Strait of Hormuz Blockade Amid Failed Iran Negotiations")
Key Takeaways
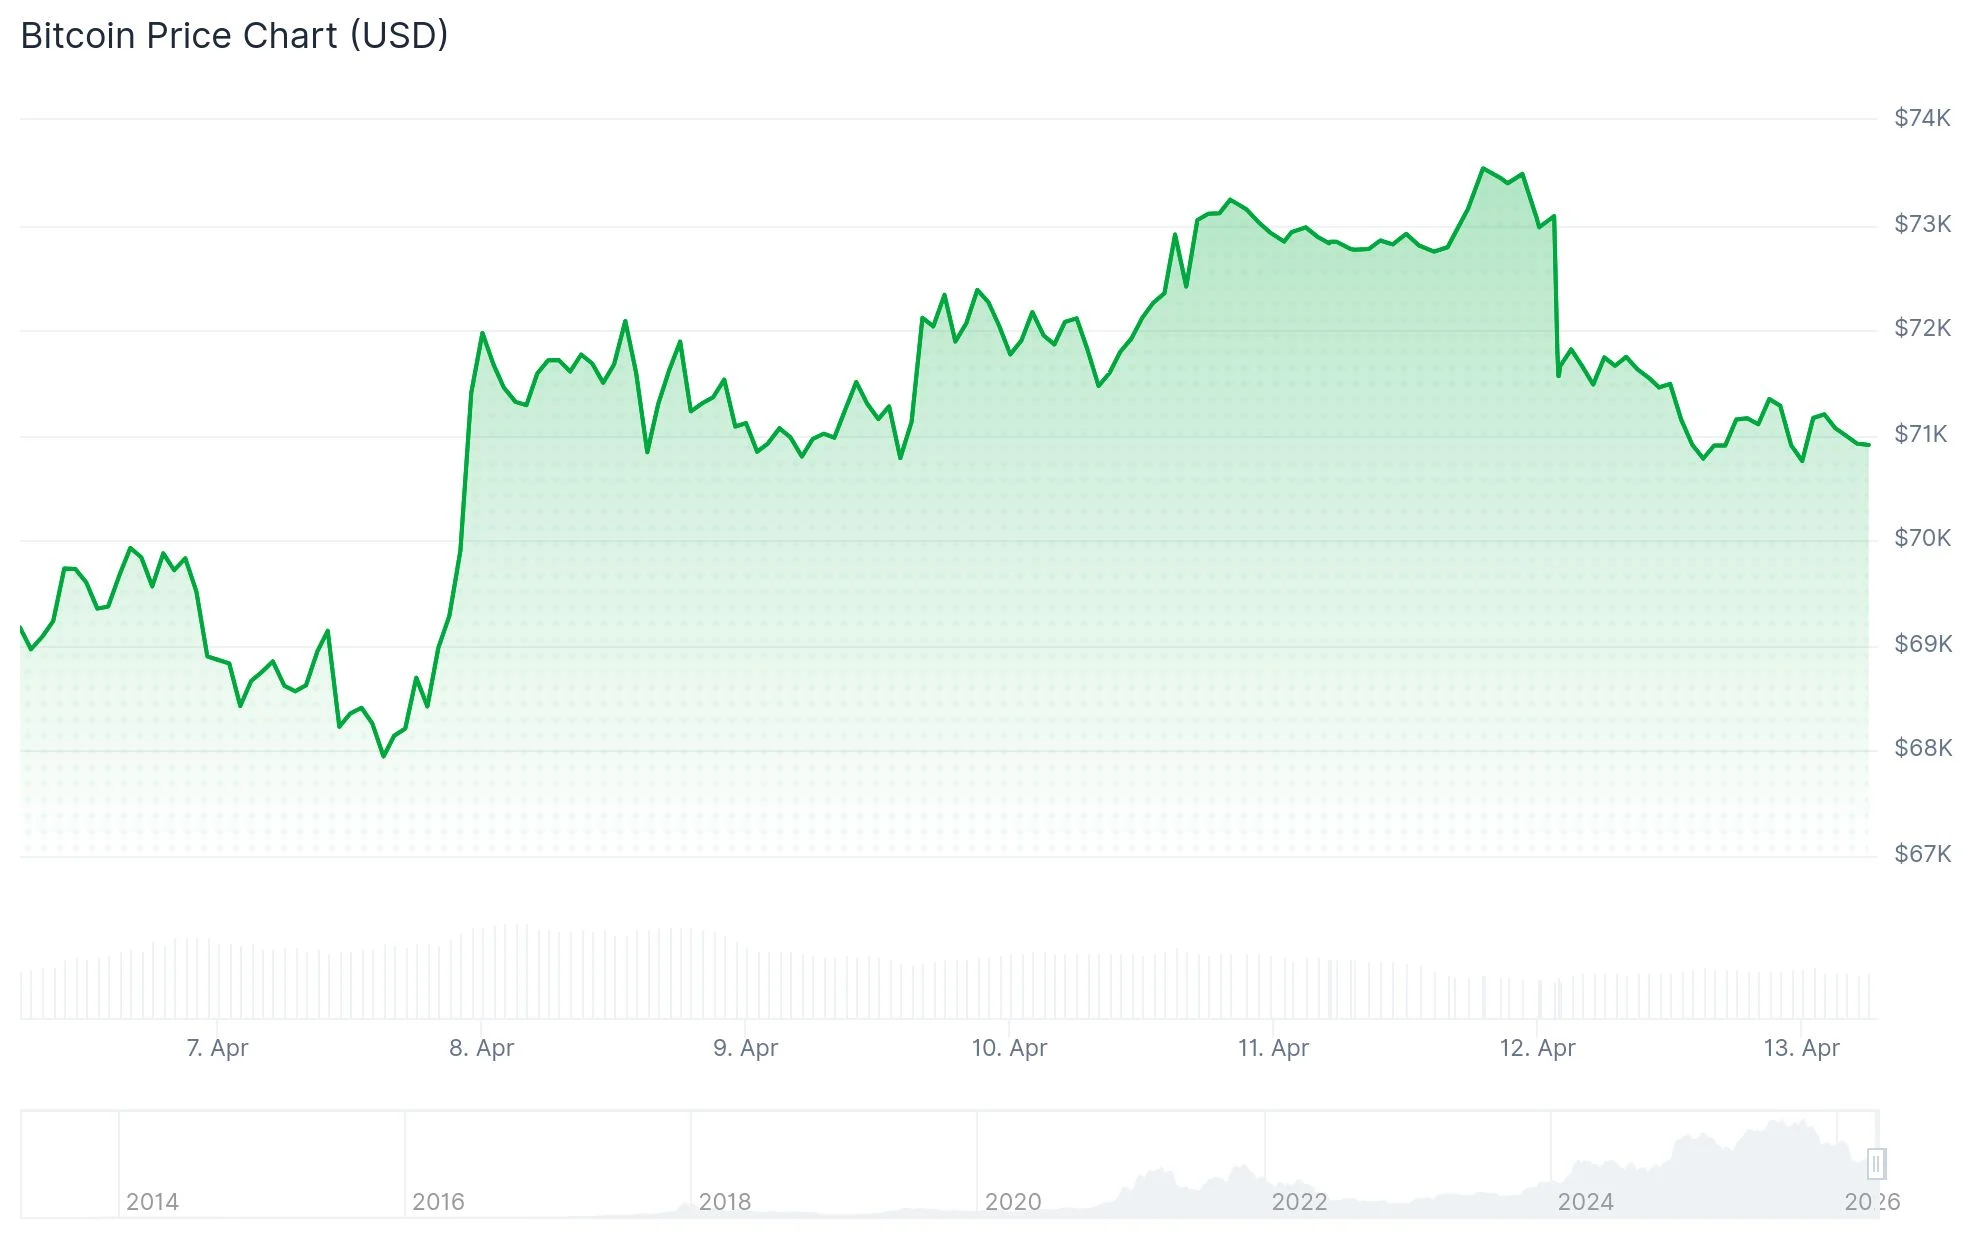
- BTC touched a low of $70,623 on Sunday following the US declaration of a Strait of Hormuz blockade
- Diplomatic negotiations between Washington and Tehran collapsed when Iran declined to halt its nuclear weapons development
- Crude oil prices surged 9.5% to reach $105 per barrel in the first half-hour of US futures trading
- Open Interest in Bitcoin futures contracts declined to $51.39 billion from the previous day’s $54.82 billion
- BTC has gained 7.4% since military tensions between the US and Iran commenced on Feb. 28
Bitcoin experienced a pullback to $70,623 on Sunday following Washington’s announcement of a naval blockade targeting the Strait of Hormuz. The aggressive military posture emerged after diplomatic efforts between the United States and Iran deteriorated over the weekend.
President Donald Trump validated the blockade through a Truth Social message, stating that Iran’s refusal to abandon its nuclear weapons development represented the singular critical sticking point in negotiations.
Vice President J.D. Vance disclosed on Saturday evening that discussions held in Pakistan failed to secure an extended cessation of hostilities. Bitcoin had maintained trading levels above $73,000 throughout most of Saturday before experiencing a sharp reversal.
Following the blockade declaration, BTC declined to approximately $70,900 — representing a 2.5% decrease across a 24-hour timeframe. The cryptocurrency dropped even further to $70,623 when US futures markets commenced trading on Sunday.

Crude oil experienced a dramatic 9.5% spike to $105 per barrel during the initial 30 minutes of market activity. Brent crude reached $98 on Monday as the military standoff persisted.
BTC Maintains Position Above $70,000 Threshold
By Monday, Bitcoin had recovered above the $71,000 mark, sustaining a position above its 50-day Exponential Moving Average (EMA) located at $70,753. This 50-day EMA is currently functioning as immediate support.
Open Interest in Bitcoin futures contracts decreased to $51.39 billion on Monday, based on CoinGlass metrics. This represents a decline from $54.82 billion recorded the previous day, indicating diminished risk appetite among leveraged market participants.

The Relative Strength Index (RSI) stands at 54, indicating moderate bullish momentum. The MACD indicator continues trading in positive territory, implying that downward pressure is subsiding.
Bitcoin’s Performance Since Conflict Escalation
Bitcoin has appreciated approximately 7.4% since military hostilities between the US and Iran erupted on Feb. 28, when a US military strike eliminated Iranian Supreme Leader Ayatollah Ali Khamenei. Bitcoin was changing hands around $71,194 at press time.

This performance positions Bitcoin favorably compared to both the S&P 500 index and gold during the identical timeframe.
The Strait of Hormuz facilitates approximately 20% of worldwide petroleum commerce. Supply disruptions in this strategic waterway have created volatility across financial markets throughout the past six weeks.
A confirmed daily close exceeding $73,000 could establish a trajectory toward $75,623 — representing the 23.6% Fibonacci retracement level of Bitcoin’s descent from $126,200 to $60,000. Primary downside support persists at the 50-day EMA near $70,753. A breakdown beneath this threshold could trigger movement toward $60,000.
Bitcoin established its all-time peak of $126,080 in October.