
 Stock Rallies From Key Support as Derivatives Activity Climbs")
Key Highlights
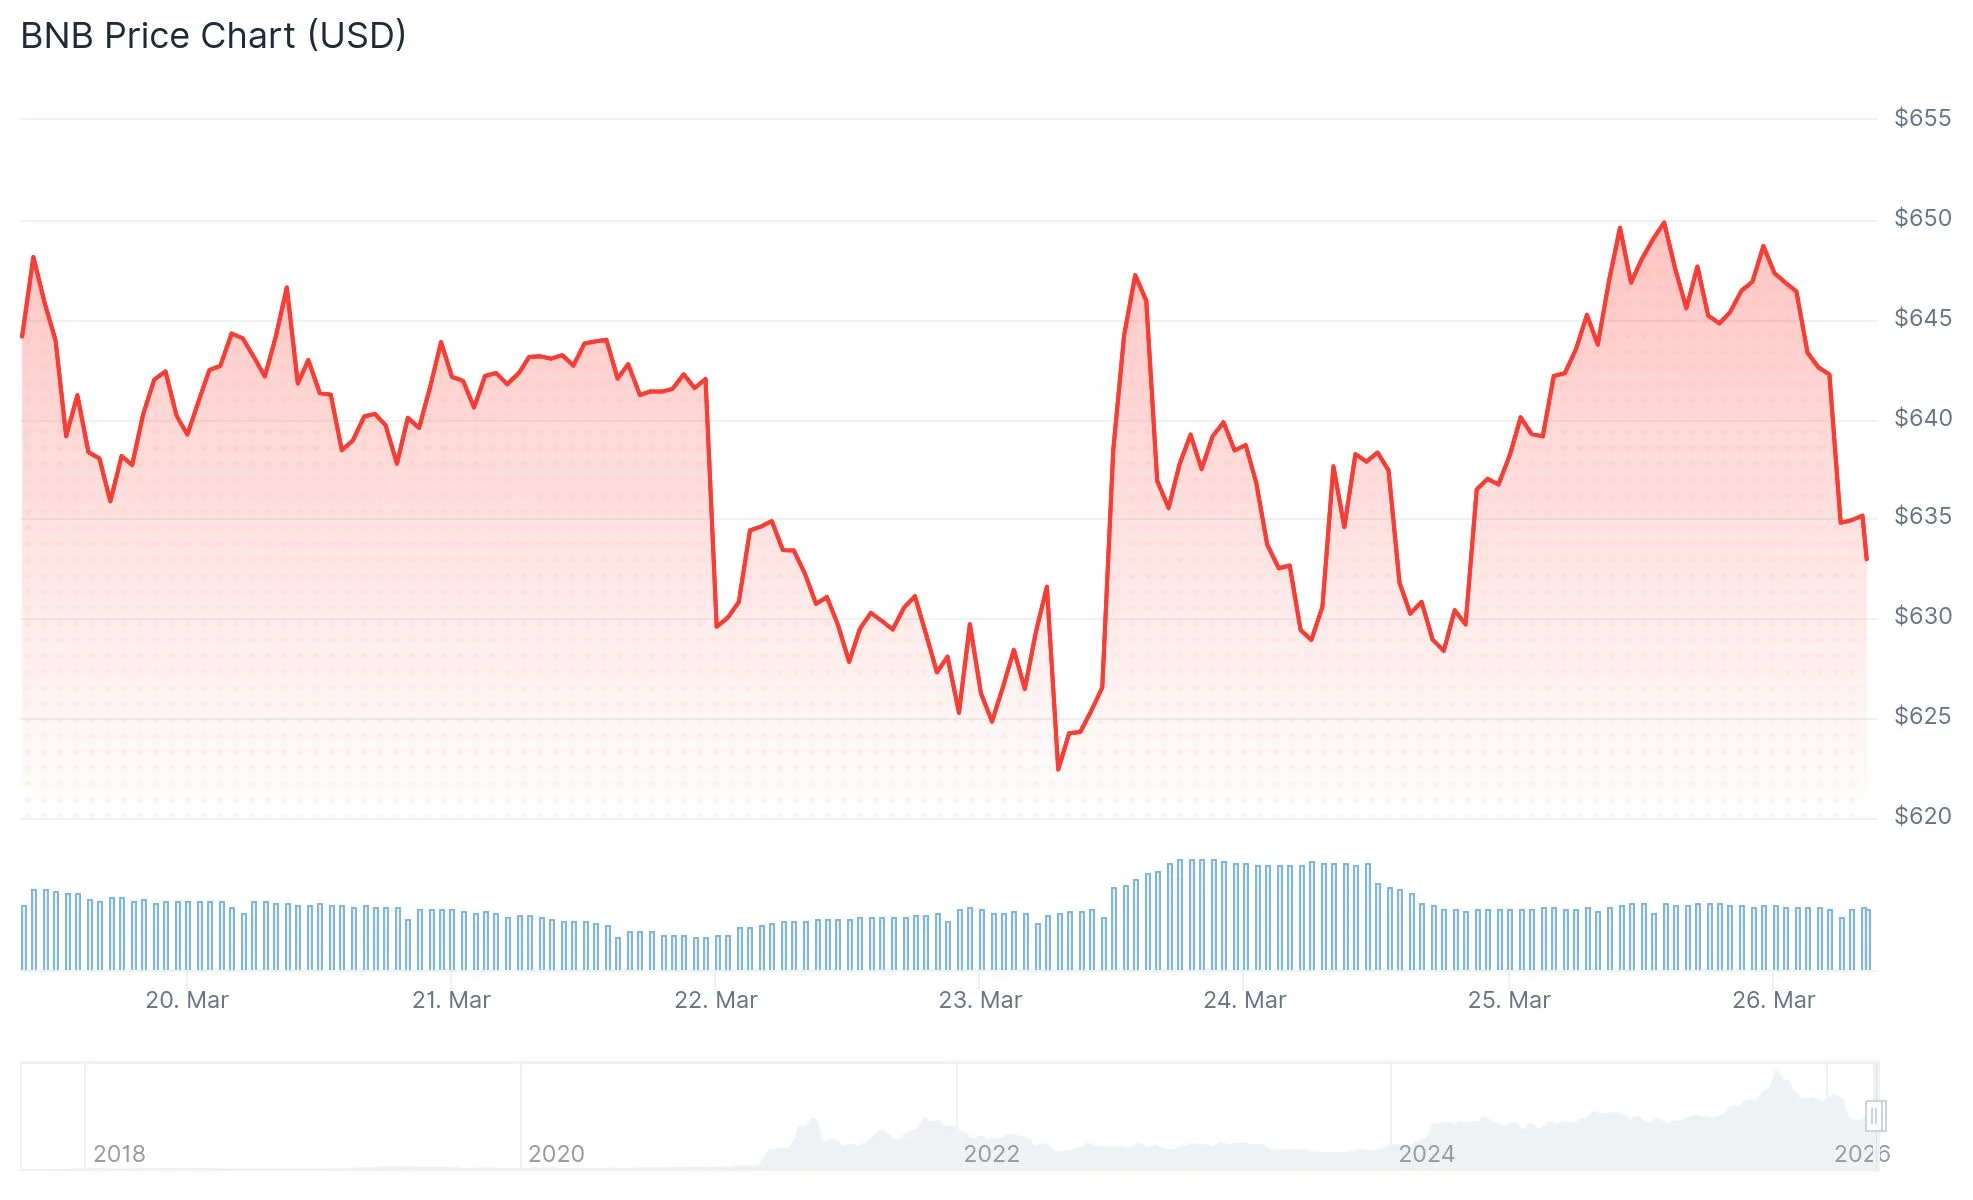
- Binance Coin recovered from a session low of $627, climbing back toward the $648 level as market conditions improved.
- Futures open interest expanded by 6.5%, reaching $923 million, while Binance’s long/short ratio exceeded 2.21.
- The token continues to respect a critical ascending trendline and remains within a bullish parallel formation on daily timeframes.
- A bullish moving average crossover has formed, with the 20-day SMA now positioned above the 50-day SMA.
- Price projections from market observers span from $2,000 to $5,000, driven by cyclical trends and fundamental network activity.
Binance Coin staged a recovery from weekend lows near $627, pushing back toward the $648 mark by Monday, March 25. The rebound mirrored a broader shift in risk appetite as diplomatic tensions between the United States and Iran showed signs of cooling.
Crude oil retreated from triple-digit levels, settling around $87 per barrel as geopolitical concerns eased. Bitcoin regained ground above the $71,000 threshold, while Ethereum moved closer to $2,200 during the same window. Major Asian equity indices, including the Nikkei 225, Hang Seng, and Shanghai Composite, registered positive sessions.
Derivatives tracking from CoinGlass revealed that open interest in BNB futures contracts expanded by 6.5% over a 24-hour span, hitting $923 million. Binance’s long/short positioning ratio exceeded 2.21, indicating a stronger bias toward bullish positions among derivatives traders.
Chart Patterns Suggest Further Gains Possible
Binance Coin maintains its position within an upward-sloping parallel channel on daily charts. The lower boundary of this formation has provided consistent support across multiple tests in recent weeks.

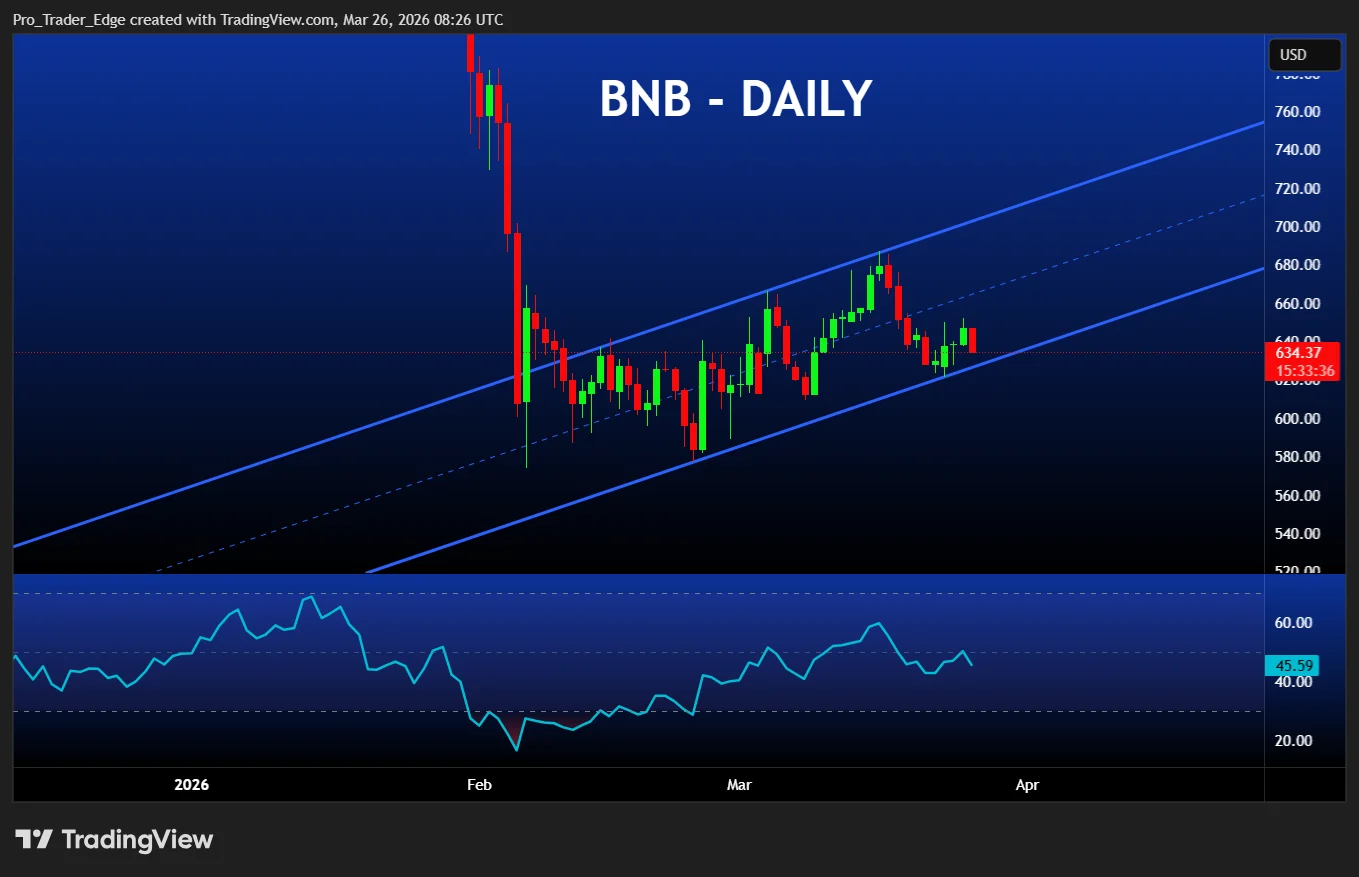
The 20-day simple moving average has recently climbed above the 50-day SMA, forming what technical analysts recognize as a golden cross pattern. This configuration typically signals strengthening near-term momentum favoring buyers. The relative strength index currently hovers near neutral territory, indicating additional headroom before entering overbought conditions.
Immediate resistance emerges at the $685 level, where price action encountered multiple rejections during early March. A sustained breakout above this threshold could pave the way toward the 100-day SMA situated near $750. Conversely, a breakdown beneath the $600 support zone would challenge the current constructive technical structure.
Binance Coin remains approximately 53% below its peak valuation, providing substantial recovery potential should favorable market dynamics persist.
Market analyst Crypto Patel highlighted $BNB’s significant discount from all-time highs, referencing historical patterns, ongoing supply reductions through burns, and robust ecosystem fundamentals to support long-term price objectives of $2,000, $5,000, and potentially $10,000, while identifying an optimal accumulation range between $300 and $420.
Token Burns and Platform Utility Drive Fundamental Support
BNB derives consistent utility from its integration across Binance’s comprehensive ecosystem. The token facilitates reduced trading fees, powers transaction costs on BNB Chain, and enables various platform services, creating sustained organic demand.
Programmatic token destruction events systematically reduce circulating supply through quarterly burns. This deflationary mechanism, combined with expanding on-chain usage metrics, forms a foundational bullish narrative among market participants.
The previously established accumulation zone spanning $300 to $420 has been decisively cleared, and cycle-based analytical frameworks now project potential targets ranging from $2,000 to $5,000. These forecasts draw from historical price behavior patterns and structural market analysis.
As of March 26, Binance Coin trades near $648, maintaining position above the critical $600 support threshold.