
 Eyes $5,000 Rally Following Bull Flag Pattern Confirmation")
Key Takeaways
- Crypto analyst Crypto Patel identifies a confirmed bull flag breakout pattern on BNB’s higher timeframe charts, projecting a $5,000 long-term objective.
- Following the breakout, the $600–$700 price range has emerged as critical support territory.
- Additional support levels are identified in the mid-$500 range, with a significant accumulation opportunity potentially emerging near the low $400s.
- Technical indicators show RSI at 59, a bullish MACD configuration, and converging EMAs near $623, suggesting sustained upward momentum.
- Reaching the $5,000 projection hinges on BNB ecosystem expansion, exchange market dominance, and favorable broader cryptocurrency market dynamics.
Binance Coin has captured market attention following technical analysis from crypto expert Crypto Patel, who identified a bull flag breakout on the weekly timeframe that suggests a potential rally toward $5,000.
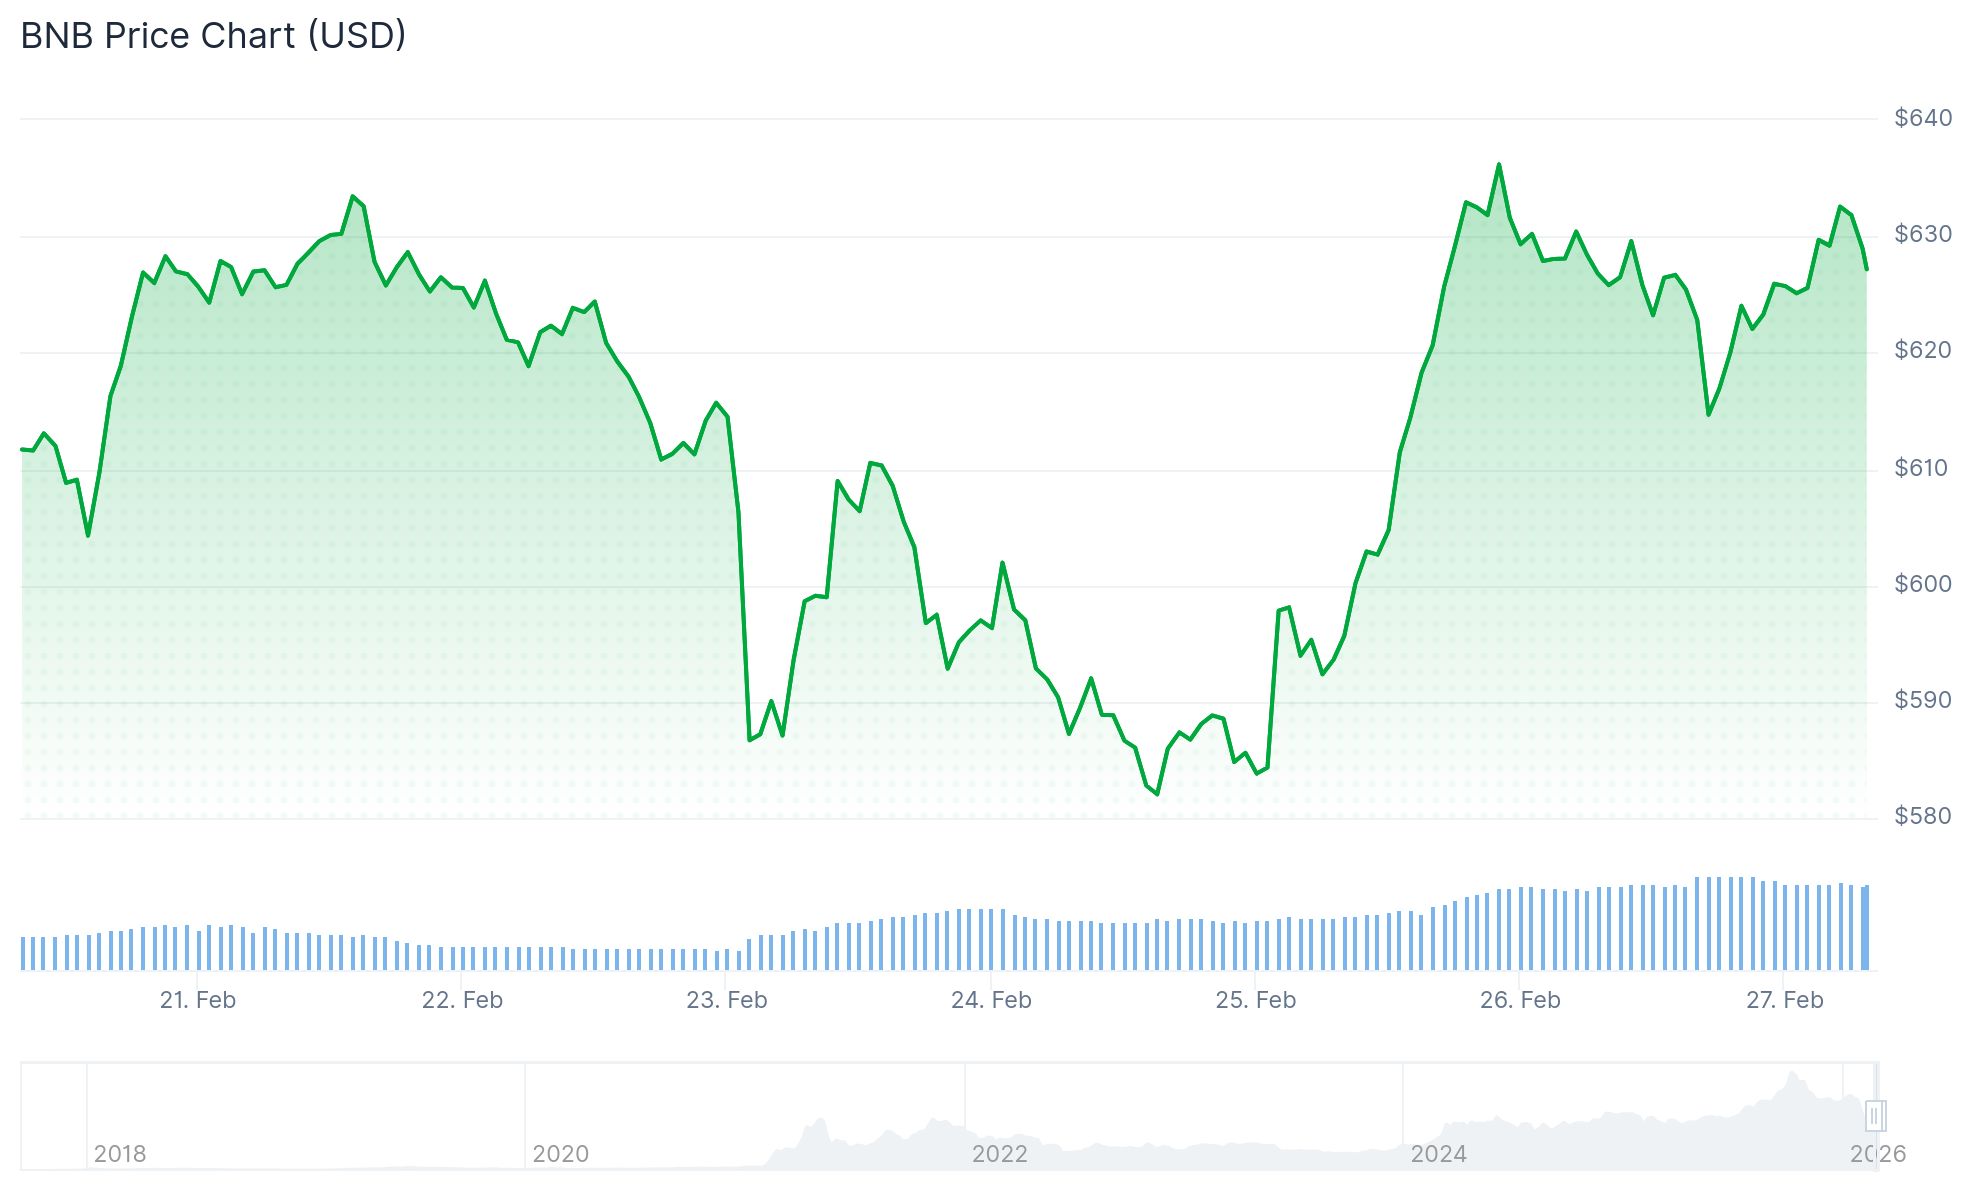
As of February 26, BNB was changing hands near $623, having touched $640 earlier before experiencing a modest retracement.
The bull flag is a continuation pattern characterized by a sharp upward move followed by sideways consolidation. Technical analysts interpret a breakout above the consolidation range as an indication that the prior uptrend may resume.
Patel presented a weekly timeframe chart illustrating BNB’s emergence from an extended consolidation period that developed after its previous cycle peak. He views the move beyond this compression zone as technical confirmation of the pattern.

The $600–$700 corridor is now considered critical support territory. According to the analysis, the bullish outlook remains valid as long as BNB maintains trading activity above this zone.
Critical Support Zones Under Focus
Beneath the current price level, another support zone exists in the mid-$500 region. Should a more substantial correction occur, BNB could retreat to what Patel identifies as an optimal “best accumulation zone” positioned near the low $400s.
The bullish framework would require a significant structural breakdown on higher timeframes to be negated, which is not presently evident in the current technical picture.
Technical Indicator Breakdown
Analysis on TradingView reveals that several EMAs — specifically the 20, 50, 100, and 200 — are clustering around the $623 level, establishing it as a pivotal short-term support and resistance zone.
The Ichimoku Cloud indicator displays price action positioned just above the cloud structure, indicating cautiously optimistic momentum. The Kijun and Tenkan lines are positioned beneath current price levels, offering support within the $615–$623 corridor.
The Relative Strength Index stands at 59, positioned above the neutral 50 threshold, reflecting moderate bullish pressure. The RSI’s moving average demonstrates an upward trajectory.
The MACD line trades above its signal line, with both components situated above the zero baseline. The histogram displays positive and expanding values, signaling that buying pressure currently dominates.
A sustained close above $623 could facilitate movement back toward the $630–$635 range. Conversely, a decline below $615 and the cloud formation may drive price action down to the $608–$610 territory.
The ambitious $5,000 target represents a long-horizon projection contingent on BNB ecosystem development, sustained exchange platform dominance, and favorable broader cryptocurrency market conditions — rather than a near-term trading opportunity.
As of February 27, BNB maintains its position above the $620 threshold, with technical indicators continuing to support the prevailing bullish perspective.
Remember: Preserve all tokens like [[EMBED_0]], [[IMG_0]], [[LINK_START_0]], [[LINK_END_0]], [[SCRIPT_0]], [[FIGURE_0]] etc. exactly as they appear. These are placeholders for embeds, images, and links that must not be changed.