

Key Takeaways
- XRP currently trades in a narrow band between $1.40 and $1.41, caught between $1.35 support and $1.50 resistance levels.
- Institutional investment vehicles recorded $13.74 million in single-day inflows, bringing total net inflows to $1.27 billion.
- Price volatility has compressed to 0.42, marking multi-year lows that traditionally signal major moves.
- All major moving averages (50-day, 100-day, and 200-day) remain above current price levels with downward trajectories.
- Technical analyst Ali Charts identified a symmetrical triangle formation suggesting a potential 35% price movement.
Ripple’s XRP token has maintained a narrow trading corridor around the $1.40 to $1.41 range, leaving market participants on both sides awaiting a decisive directional move. Despite posting approximately 8% gains over the trailing week amid improving overall market sentiment, the cryptocurrency remains unable to penetrate the critical $1.50 threshold.
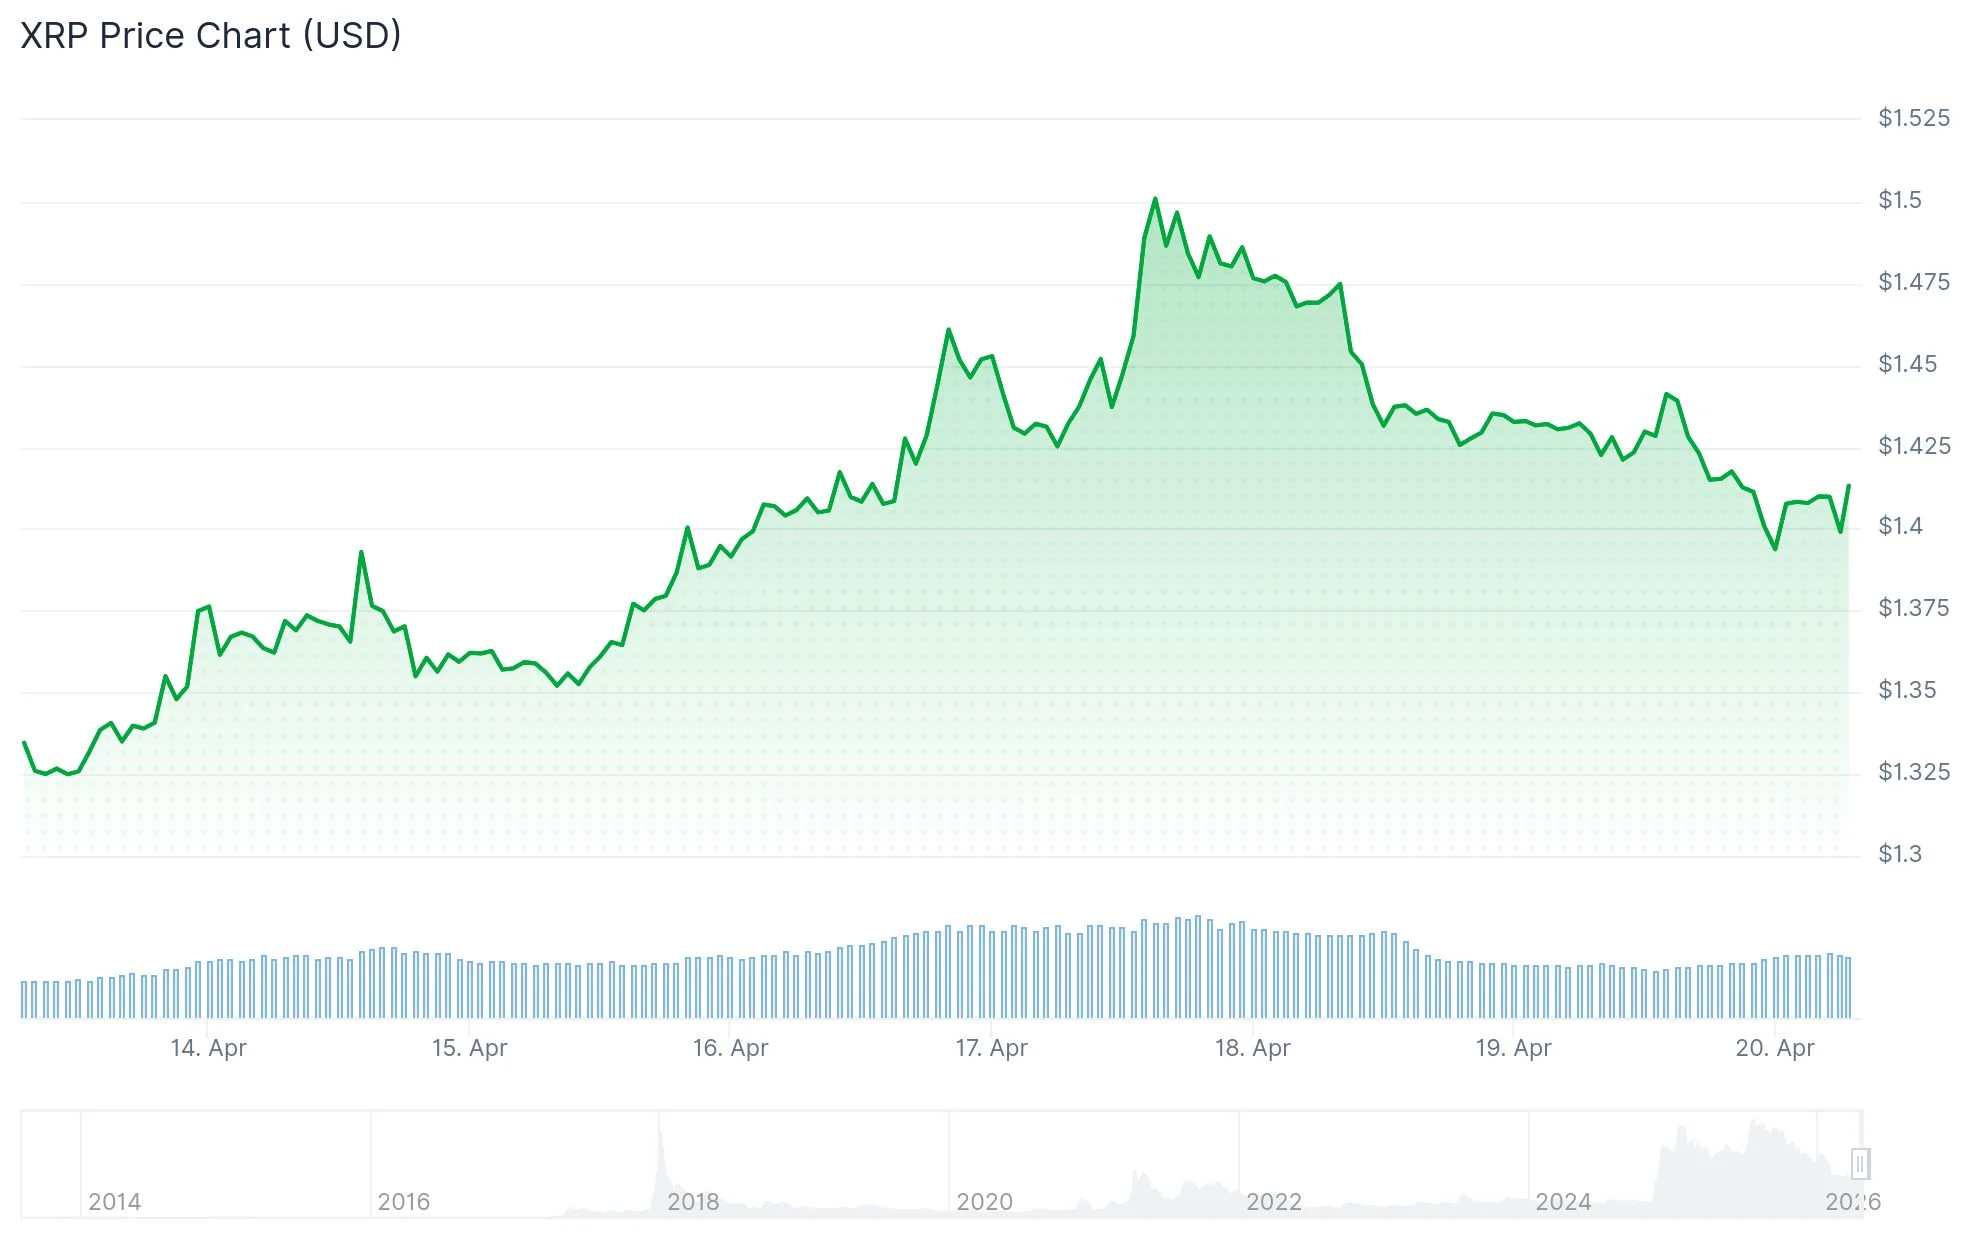
The $1.50 price level has consistently rejected upward momentum over recent weeks. Market participants who accumulated positions at lower price points appear to be liquidating holdings near this resistance zone, creating supply pressure that stifles bullish attempts.
From a macroeconomic perspective, market participants are closely monitoring the Federal Reserve’s April 28 policy announcement. Any guidance regarding interest rate trajectory could trigger sentiment shifts throughout cryptocurrency markets, with potential implications for XRP.
Concurrently, Bitcoin surged past $77,000 while Ethereum breached $2,300, catalyzing renewed buying interest across the digital asset ecosystem. Alternative cryptocurrencies including Solana, Cardano, and Dogecoin similarly registered modest appreciation during this timeframe.

Capital Flows Remain Robust
Investment vehicles focused on XRP continue experiencing steady capital accumulation. Recent data indicates $13.74 million in daily inflows, elevating cumulative net inflows to an impressive $1.27 billion. These figures underscore sustained institutional appetite for the asset.
Meanwhile, U.S.-listed spot Bitcoin exchange-traded funds registered $664 million in single-session inflows, extending their positive flow streak to four consecutive trading days. Spot Ethereum ETFs captured $127 million in new capital, marking their seventh consecutive day of net inflows.
Technical Analysis Breakdown
From a technical perspective, XRP remains range-bound within clearly defined parameters. Daily timeframe analysis reveals support anchored around $1.35 with resistance consistently rejecting advances at $1.50. The MACD indicator shows gradual upward convergence while histogram bars contract, indicating diminishing bearish pressure.
The Relative Strength Index hovers near 54, reflecting neutral market conditions. Current price action suggests neither accumulation nor distribution is dominant at this juncture.
Cryptocurrency analyst Ali Charts highlighted on X platform that XRP is developing a symmetrical triangle formation—a technical pattern known for preceding sharp directional movements. According to Ali Charts, this configuration points toward a potential 35% price swing, though the breakout direction remains undetermined.
Examining longer timeframes reveals a more cautious outlook. XRP reached peak levels exceeding $3.00 during mid-2025 before entering a sustained downtrend characterized by successive lower peaks and troughs. A significant volume spike during early February 2026 flushed out leveraged positions and recalibrated market structure, yet price discovery has remained stagnant subsequently.
XRP’s 30-day Realized Volatility Index has contracted to approximately 0.42, representing the lowest measurement since 2024. Historical analysis suggests such volatility compression typically precedes substantial price movements rather than prolonged consolidation phases.
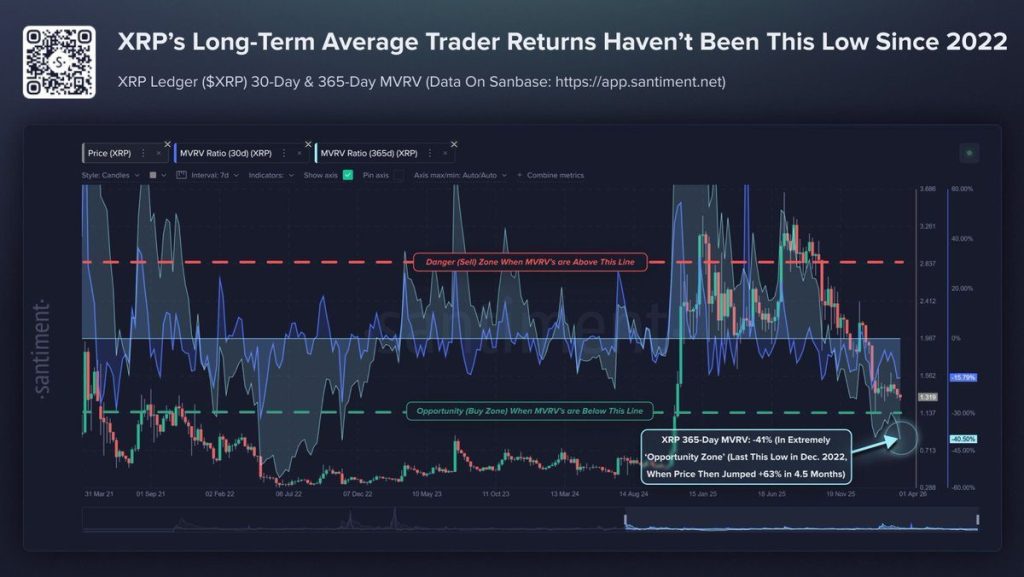
Blockchain analytics reveal most token holders currently sit in unrealized losses. The Market Value to Realized Value (MVRV) ratio reflects levels consistent with previous periods of market capitulation, while the percentage of supply in profit remains subdued. XRP has depreciated roughly 30% on a trailing twelve-month basis.
The critical level demanding attention remains $1.50. A convincing breakout and sustained price action above this threshold would represent the first tangible evidence of trend reversal. Conversely, should $1.30 support fail, minimal structural support exists below current levels.