
 Stock: Will SOL Rally to $90 or Face Another Decline?")
Key Takeaways
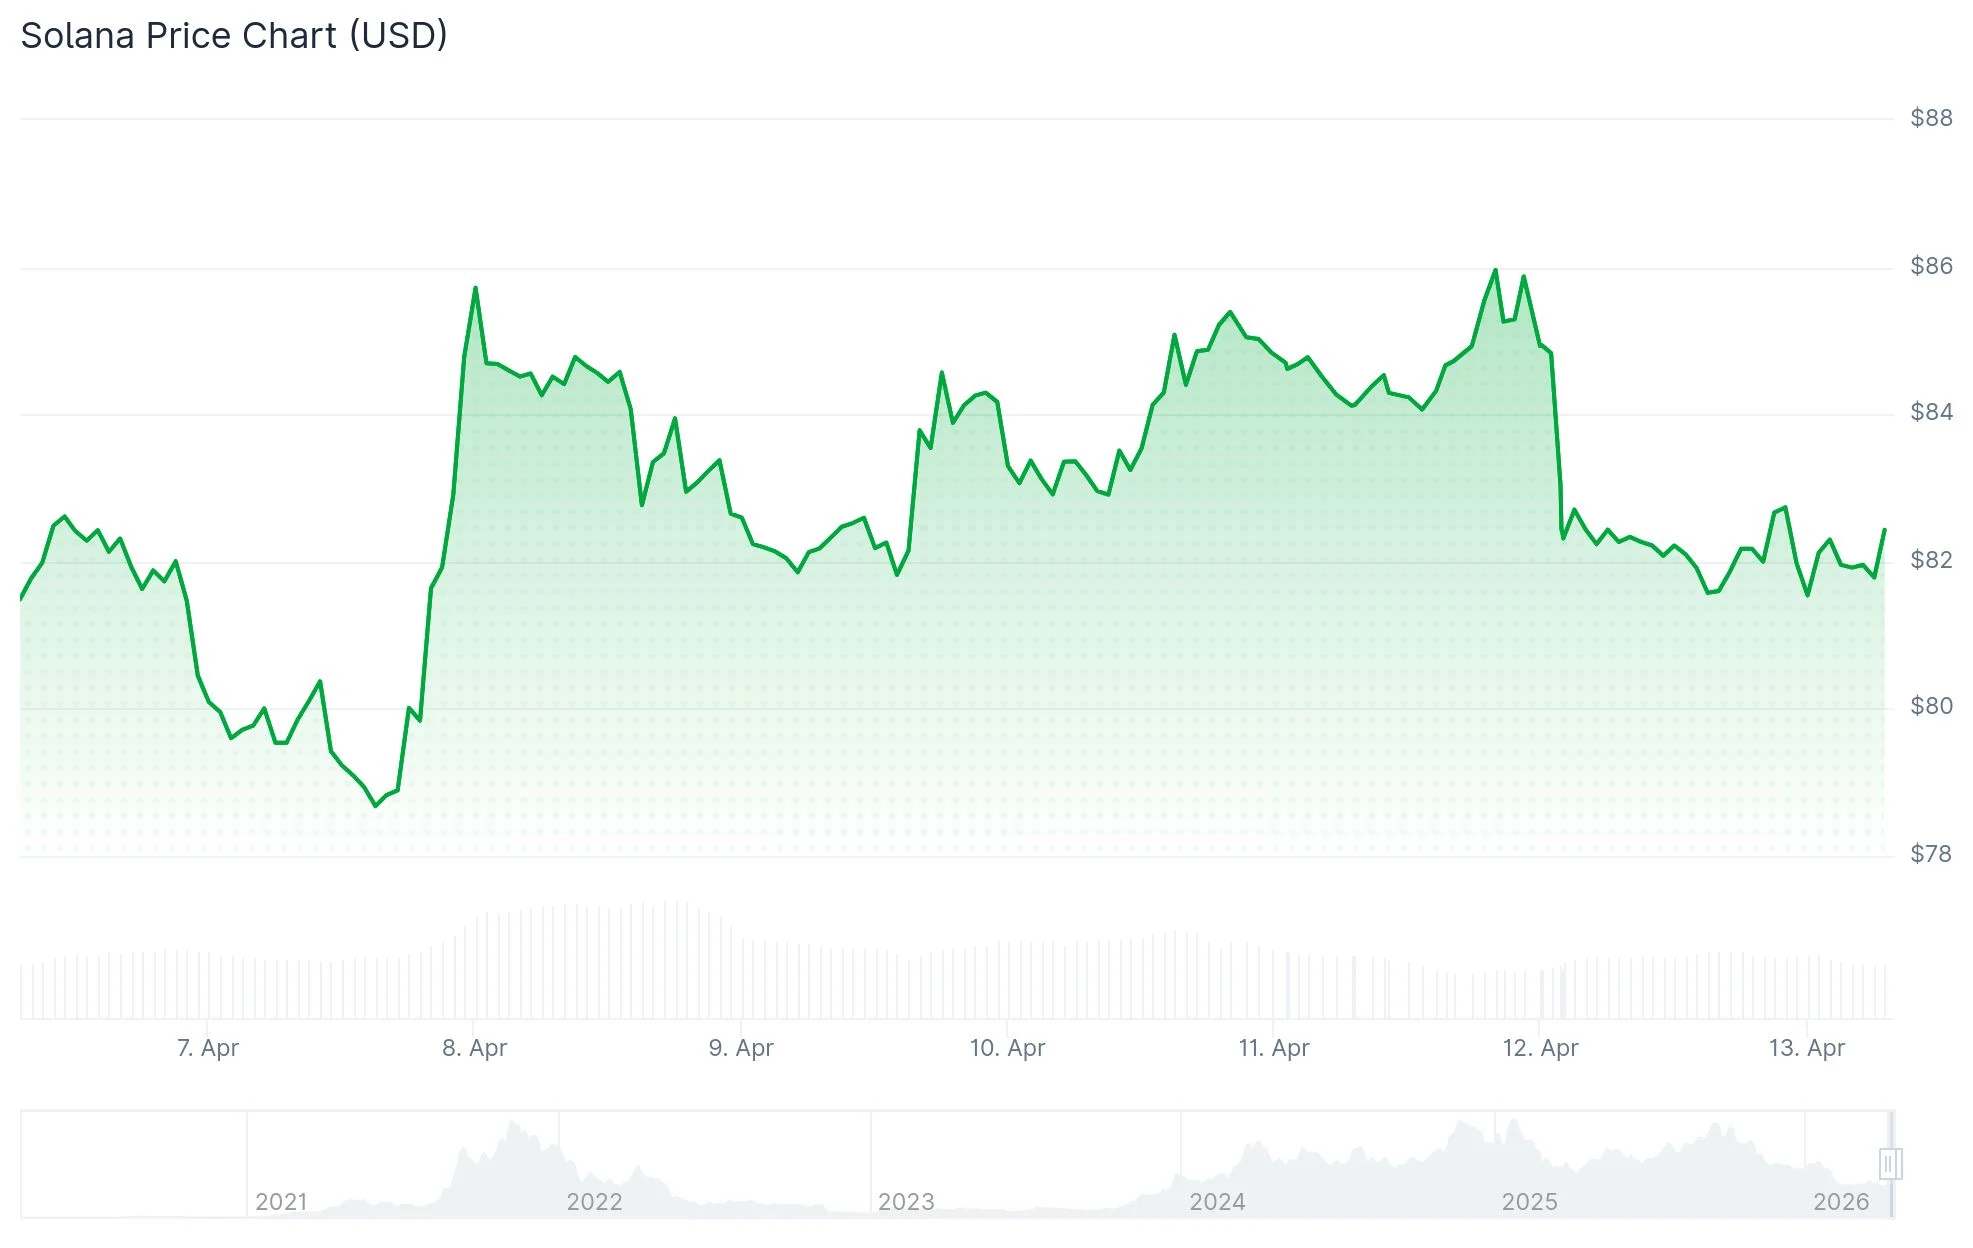
- SOL is currently trading around the $80 level with key resistance positioned near $87
- Technical analysis using Fibonacci levels points to a potential $88–$90 price target
- Weekly timeframe analysis maintains a bullish long-term scenario toward $1,000
- Solana ETFs experienced more than $17 million in net outflows during the past week
- Open interest has dropped to $4.72 billion, indicating reduced futures market participation
Solana’s price action has stabilized near the $80 mark in early trading this week after experiencing a 4% decline on Sunday. This downward movement coincided with a general cryptocurrency market correction. The digital asset has been trading within a defined range, with bulls finding it challenging to overcome a critical resistance barrier.
The 50-day exponential moving average currently stands at $87.43, aligning closely with a downward-sloping trendline. This confluence has consistently rejected price advances. Above that, the 100-day EMA rests at $99.19 and the 200-day EMA at $118.32, creating additional overhead resistance layers.
According to short-term technical analysis from MCO Global, a gradual recovery pattern suggests movement toward a Fibonacci-based target zone spanning $88.13 to $90.01. Multiple projected wave patterns converge at this identical range, establishing it as the next logical price objective should the current recovery momentum persist.
Critical support levels are located between $71.92 and $77.92. The most immediate support floor is found at $77.60, matching the February 5 low. A decisive breach below this level could trigger a decline toward $67.50.

Institutional Flows Show Weakness
Solana-based exchange-traded funds registered outflows exceeding $17 million throughout the week. The bulk of these withdrawals occurred during the early part of the week. Friday brought some relief with $11.45 million in new inflows, which reduced the weekly net outflow figure to $5.62 million.

This represents the third consecutive week of negative net flows from Solana ETF products. The pattern suggests waning institutional demand for SOL exposure at present price levels.
Derivatives data shows open interest declining to $4.72 billion on Monday, retreating from the previous day’s $4.88 billion. Funding rates continue to hold in marginally positive territory, indicating long positions maintain a slight advantage over short positions.
The Relative Strength Index remains positioned below the 50 midpoint, signaling subdued buying pressure. The MACD indicator trades below the zero line, though recent price action hints at potentially diminishing bearish momentum. However, no definitive bullish reversal pattern has materialized.
Weekly Timeframe Supports $1,000 Bull Scenario
Technical analyst James Easton highlights the weekly chart perspective, suggesting the overarching market structure remains healthy. According to his analysis, Solana continues trading within a broad ascending channel without violating the larger bullish framework.
He identifies an ambitious long-term bullish target at $1,000, contingent upon SOL avoiding a significant breakdown and eventually recapturing upward momentum. From this perspective, the current price weakness appears to represent consolidation rather than structural deterioration.
The weekly MACD continues displaying softness, with momentum indicators yet to confirm a bullish turn. This suggests the extended-timeframe bullish thesis remains viable but requires considerable patience before potential validation.
Solana’s latest market data confirms price support just above the $80 threshold, with market participants closely monitoring the $87–$90 zone as the next significant price area.