
 Stock Price Gains Momentum as Bulls Reclaim Market Control")
Key Takeaways
- ETH maintained its position above the $2,000 threshold while derivative metrics indicated increased buying momentum.
- Positive net taker volume has persisted since early March, signaling heightened buyer engagement.
- Open interest in futures contracts reached 6.4 million ETH, approaching previous year highs.
- Spot ETH ETFs recorded $120 million in net inflows, marking the strongest single-day performance since mid-March.
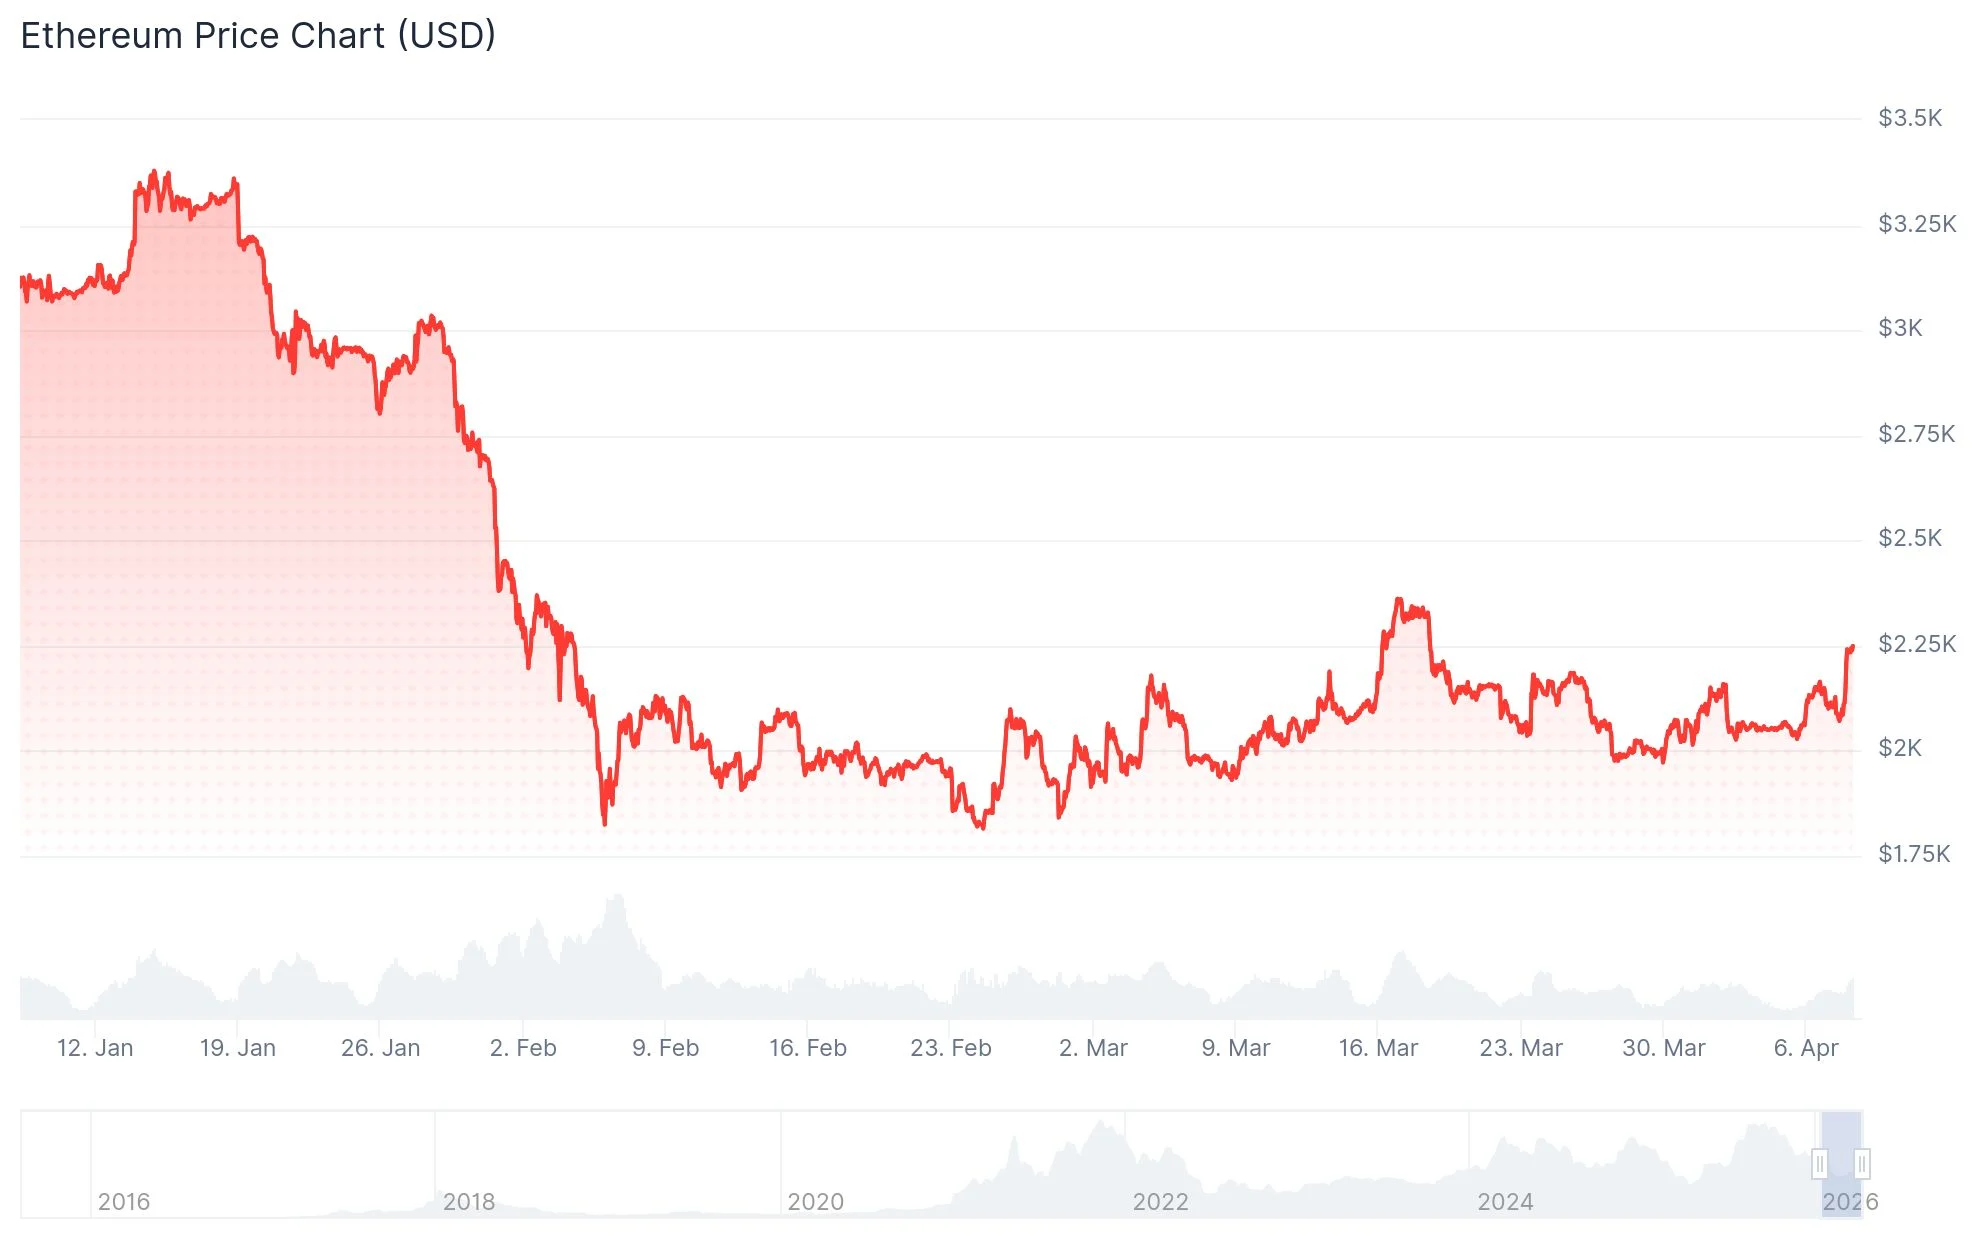
- Market observers emphasize that maintaining the $2,000 level is crucial, with additional support identified between $1,750 and $1,800.
Ethereum (ETH) was trading near $2,249 following a bullish surge that saw buyers successfully protect the crucial $2,000 threshold. Emerging market indicators point toward strengthening demand conditions.
Market analysts examining derivative market behavior indicate that purchasing activity is currently dominating. This transition has sparked speculation about a potential trend reversal.
Since March 6, net taker volume has consistently registered positive values. This indicator reveals whether aggressive purchasing or selling forces are dominating derivatives markets.
Darkfost, a market analyst, noted that buying momentum remains strong with net taker volume reaching $104 million. He highlighted that this represents the first time since the previous bear cycle that Ethereum derivatives have demonstrated such a notable transition.

Stronger Demand Reflected in Derivatives Markets and ETF Activity
The analyst further suggested that this configuration could foster a bullish trajectory if sustained alongside improving spot market demand. Increasing futures market participation reinforces this perspective.
Open interest in Ethereum futures has risen to 6.4 million ETH. This figure approaches the record high of 7.8 million ETH observed in July 2025.
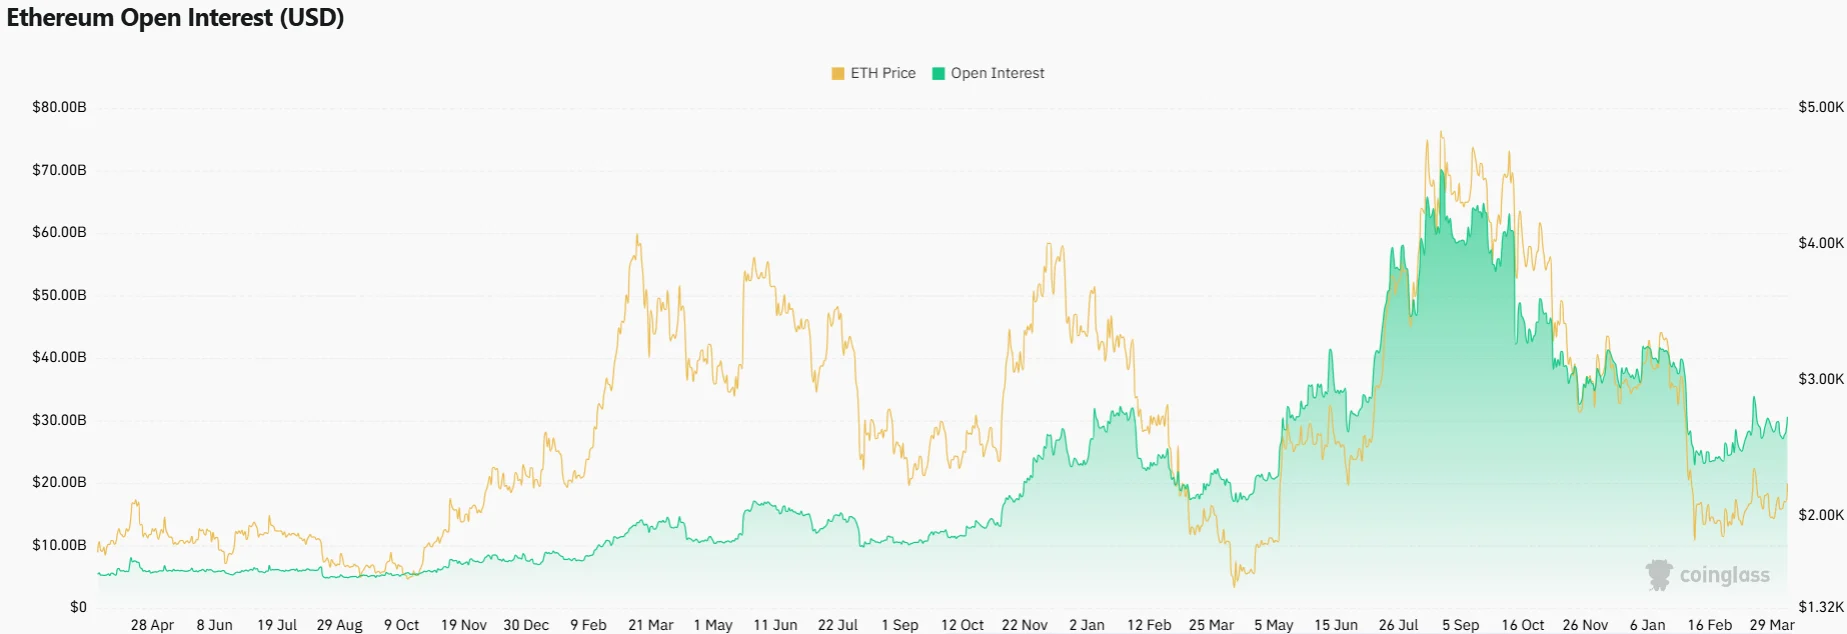
After declining to 5 million ETH in October, open interest has since recovered. This rebound demonstrates continued engagement in derivatives trading.
Spot Ether ETFs exhibited a notable shift in investor appetite. These investment vehicles captured $120 million in net inflows on Monday, representing the strongest single-day performance since mid-March.
This influx arrived after a brief period of capital withdrawals. The renewed inflows indicate renewed buying interest from US-based market participants.
Ethereum experienced a short-term price rally beyond $2,250 before encountering resistance. Technical analysis of the hourly timeframe shows price breaking through a contracting triangle resistance level near $2,150 before pulling back.
The Significance of the $2,000 Price Level
Market technicians note that Ethereum’s chart structure remains favorable provided the $1,800 to $2,000 support range holds firm. This zone coincides with the 20-day exponential moving average and the lower boundary of a symmetrical triangle pattern.
Ted Pillows indicated that Ethereum could stage another upward movement if $2,000 remains intact. He cautioned that a breakdown below this threshold might trigger a decline toward fresh yearly lows.
On-chain cost basis analysis reinforces the $2,000 region as a significant support area. Over 3.5 million ETH tokens were purchased near this price point.
Beneath this level, an additional demand cluster exists between $1,750 and $1,800, where 1.36 million ETH were accumulated. A breach of this range would target the triangle projection near $1,460.
Ali Charts shared in a recent post that Ethereum’s 0.80 MVRV band is positioned around $1,880. He noted that this level has historically marked zones where selling pressure diminishes and committed holders increase their positions.
For near-term price action, key support levels include $2,220, $2,165, and $2,120. Overhead resistance is identified near $2,250 and $2,275, with current price action maintaining stability above the $2,200 region.