
 Stock: Critical $2,150 Resistance in Focus as Price Climbs Past $2,080")
Key Takeaways
- ETH has climbed past $2,080 with immediate resistance positioned at $2,150
- The $2,000 threshold represents crucial support — a breakdown could spark significant long position liquidations
- Clearing the $2,150–$2,180 zone may unlock a path toward $2,220–$2,350
- Historical price action reveals an ascending channel pattern extending from 2022
- Technical analyst Ali Charts identifies $1,551 and $1,070 as important lower support zones if the channel fails
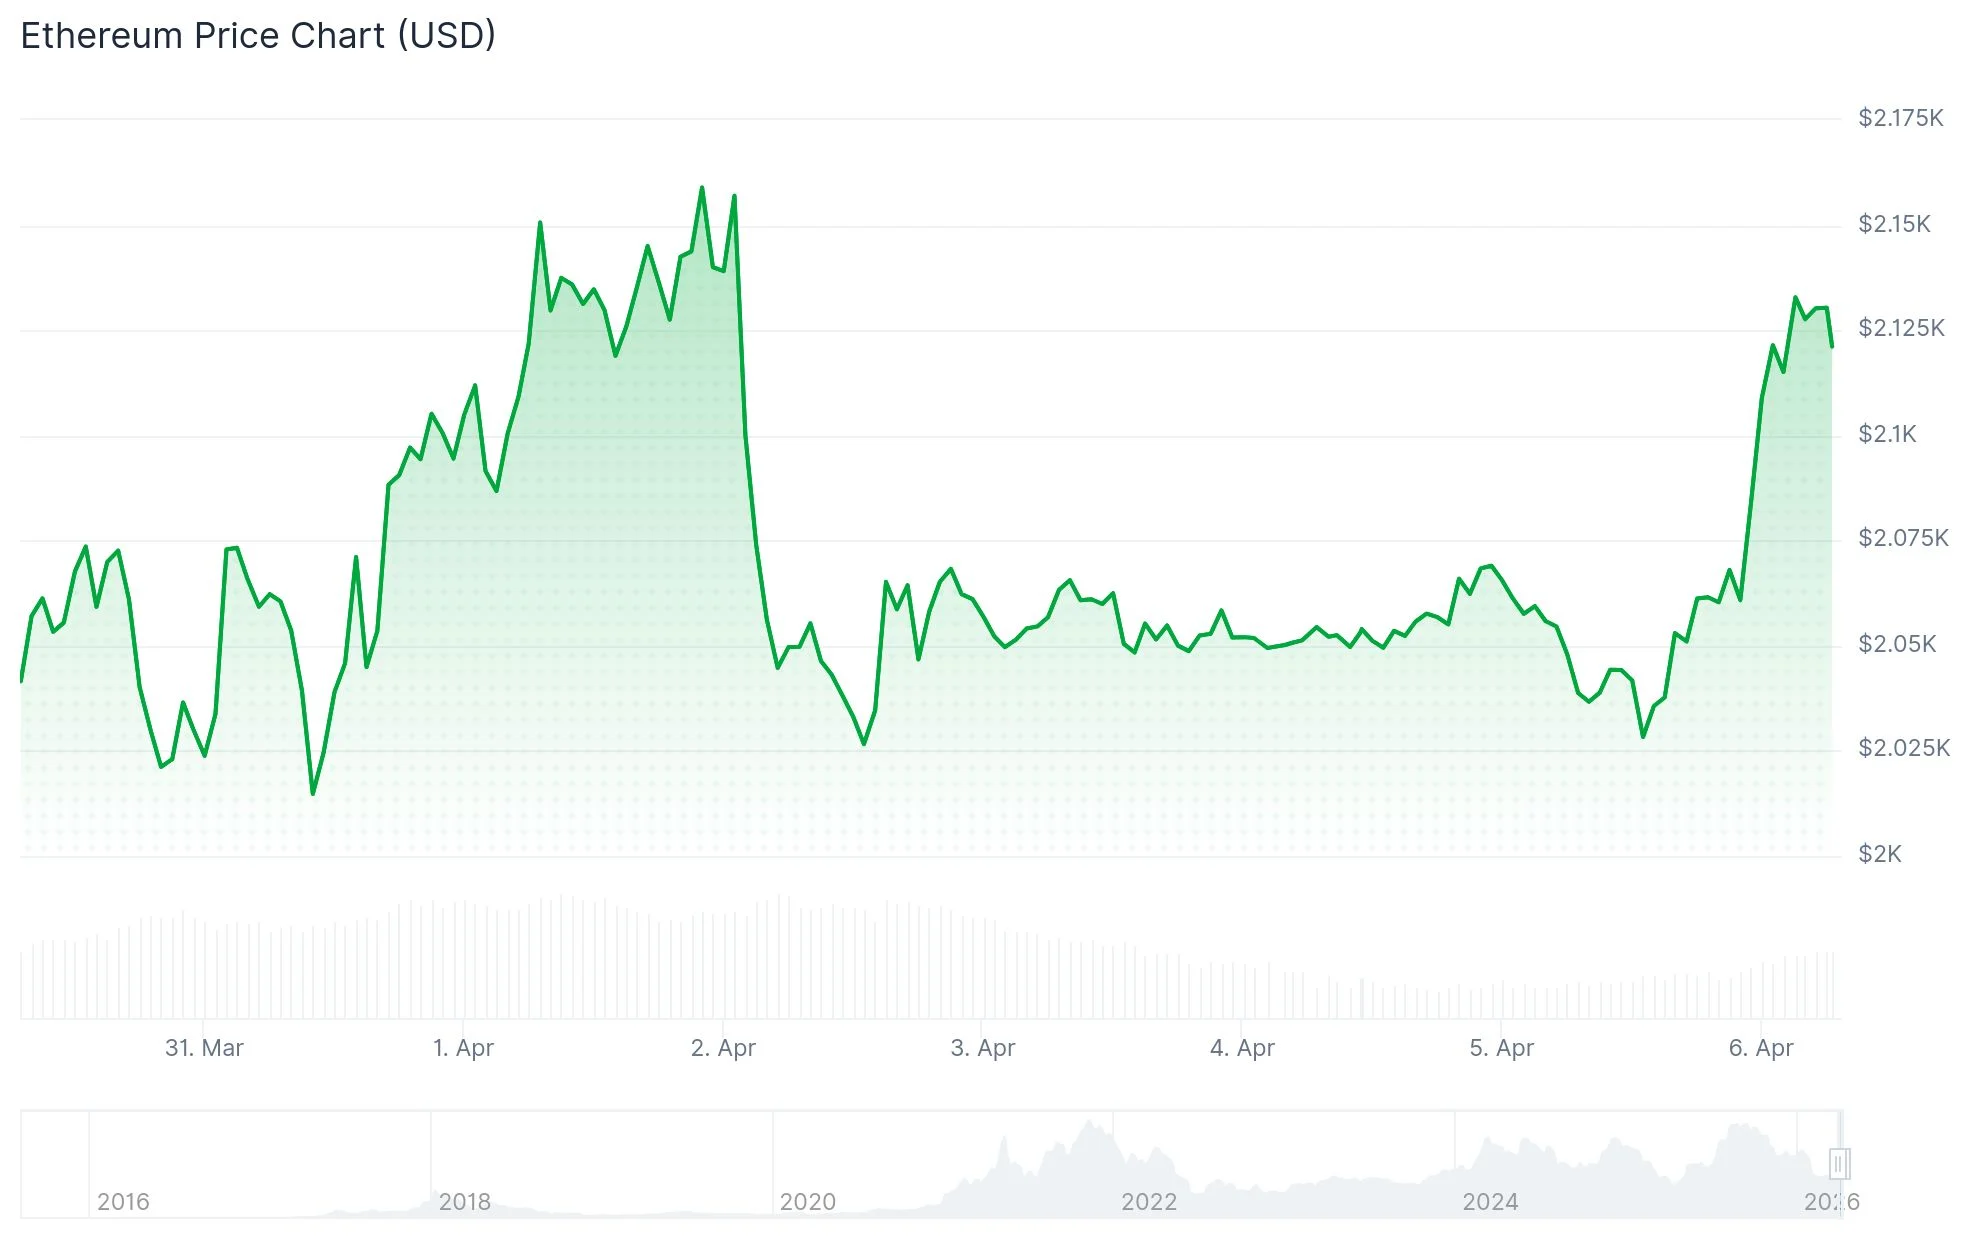
Ethereum has climbed beyond the $2,080 mark following a rebound from approximately $2,017. The digital asset successfully breached a significant descending trend line at $2,065 on the 60-minute timeframe and currently holds position above its 100-hour Simple Moving Average.
This upward movement carried ETH beyond the 50% Fibonacci retracement point measured from the $2,168 peak to the $2,017 trough. The current positioning places it near the 83.2% Fibonacci level around $2,140, which coincides with the primary resistance area.
The crucial price point demanding attention is $2,150. This zone has demonstrated repeated rejection patterns, establishing it as an important near-term obstacle. For continued momentum, bulls must achieve a decisive breach of this barrier.
Should ETH successfully penetrate $2,150, the subsequent resistance emerges at $2,180. Breaking through that threshold could expose $2,220, with extended targets reaching $2,350 and $2,380.

Potential Downside if Bulls Fail at $2,150
Should the price encounter resistance at $2,150, the first support level emerges at $2,080, with $2,065 providing additional backing. Declining beneath $2,065 might drive ETH toward $2,020, while $1,980 and $1,965 represent deeper support zones.
Trader Ted highlighted the $2,000 zone as particularly significant. A decline through this level might catalyze substantial liquidation activity, given the concentration of leveraged long positions likely clustered around this threshold. Such forced liquidations could intensify downward pressure toward $1,755 or potentially $1,693.
The near-term trading range is clearly established. ETH appears to be consolidating for either a decisive move above $2,150 or faces the possibility of accelerated decline should $2,000 support crumble.
Macro Technical Picture Maintains Bullish Structure
From a broader perspective, technical analyst James Easton UK presented a chart illustrating Ethereum trading within an expansive ascending channel originating in 2022. The lower boundary has successfully absorbed multiple significant retracements, with demand consistently emerging near that support zone.
The upper channel boundary has also been approached during stronger rallies, forming a broad pattern where substantial corrections haven’t compromised the overarching uptrend. This formation remains valid provided the rising support line continues to hold.
Analyst Ali Charts indicated on X that assuming ETH maintains its channel structure, $1,551 and $1,070 represent the critical support zones to monitor beneath present valuations.
As of April 6, 2026, Ethereum has gained 0.55% and trades above $2,080, with the $2,150 resistance zone serving as the next critical challenge for bullish momentum.