
 Stock Plunges Below $600 Amid Global Market Turmoil – Critical Levels to Monitor")
Key Takeaways
- BNB experienced a sharp decline exceeding 5%, breaking through the critical $600 threshold
- Crude oil prices rocketed beyond $110 amid intensifying Middle Eastern conflicts, weighing heavily on cryptocurrency assets
- Technical analysis reveals three straight bearish indicators on the 4-hour timeframe pointing to institutional distribution
- Continued downward pressure could push prices toward the $520 zone
- Daily RSI readings have declined beneath the 40 level, reinforcing negative market sentiment
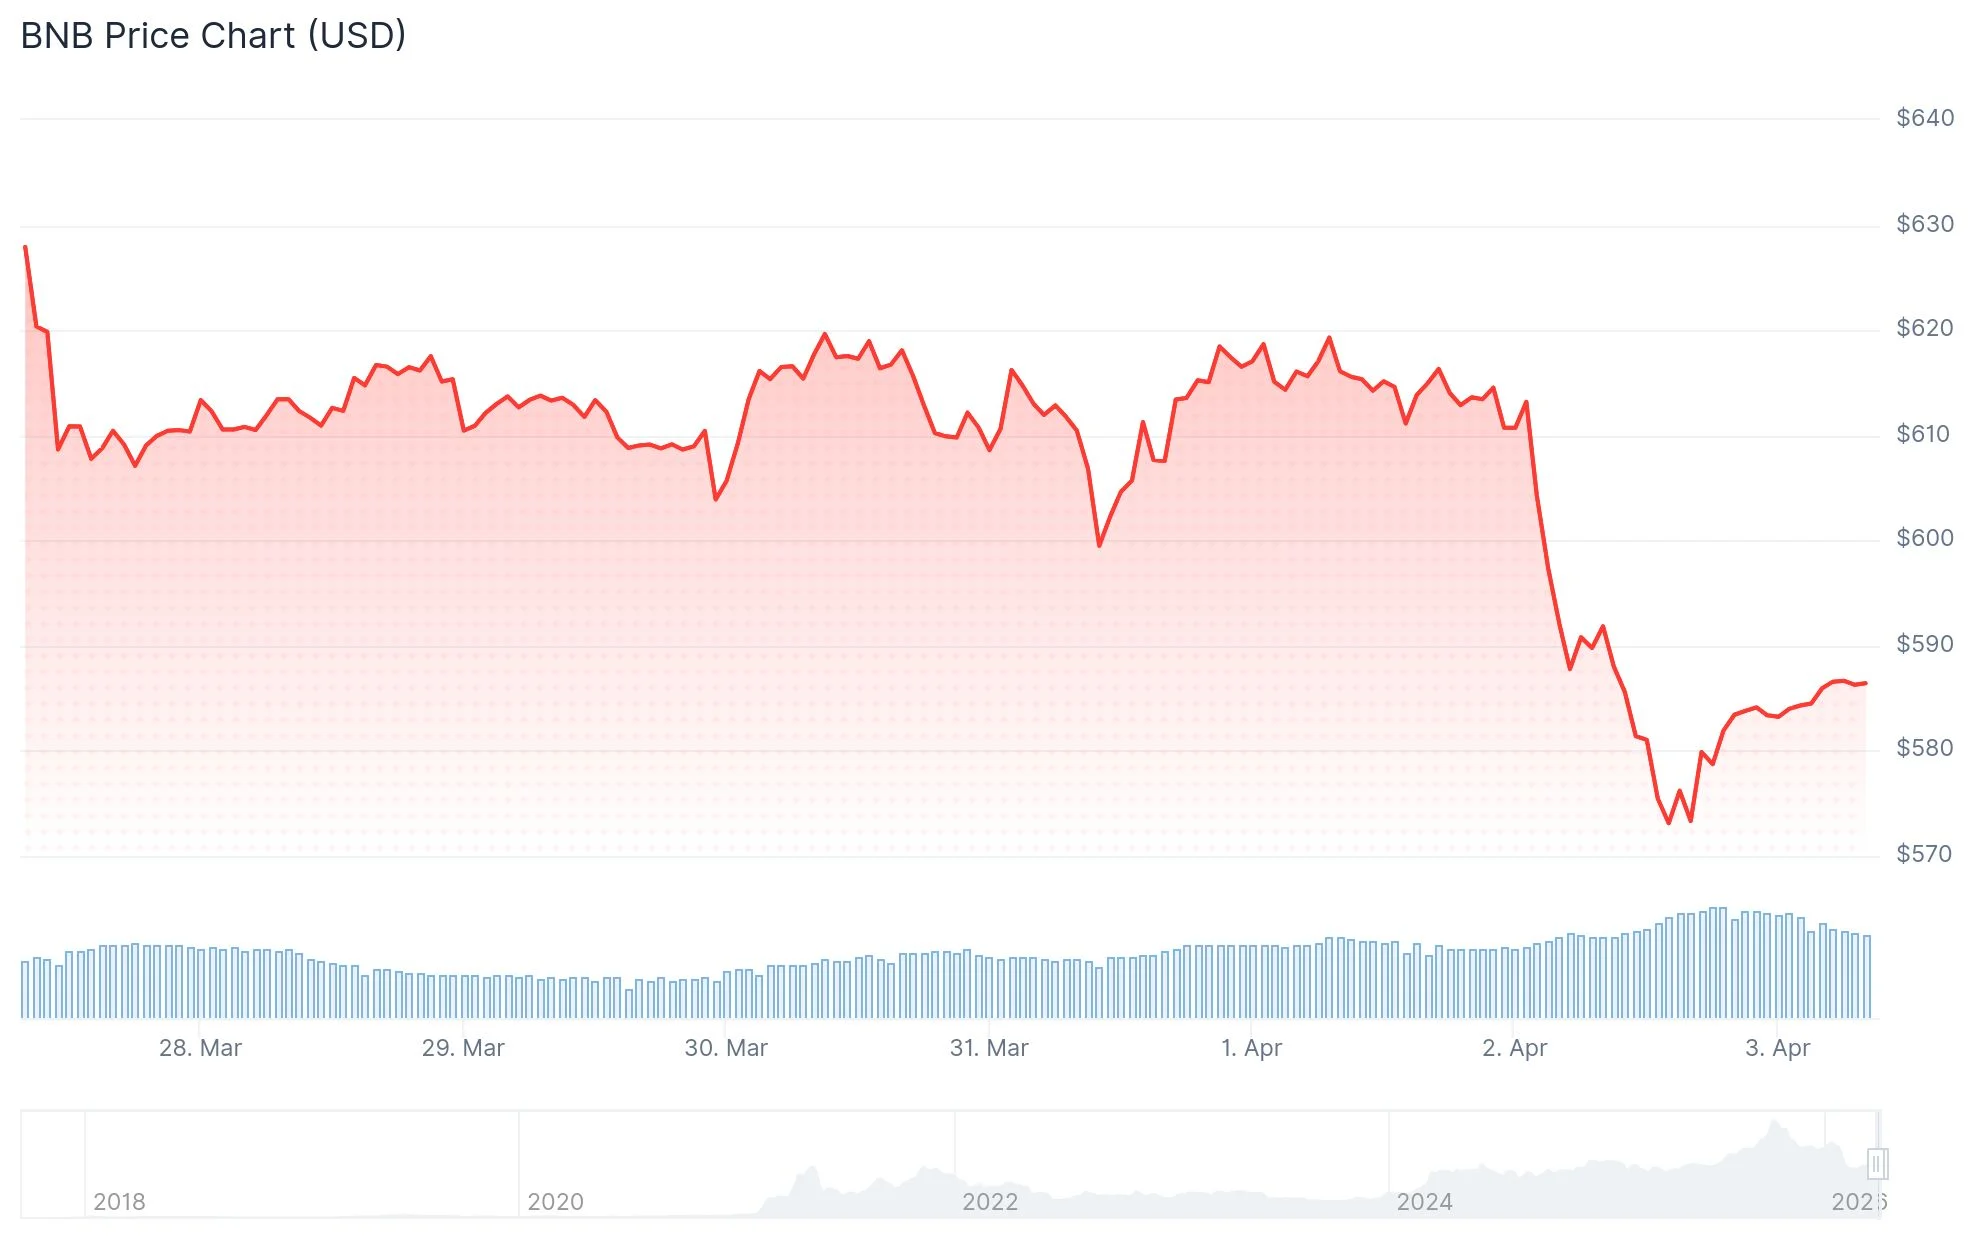
BNB has experienced a significant decline of over 5% during a single trading period, penetrating the closely monitored $600 threshold that market participants had been tracking. The digital asset momentarily reached $580 before establishing temporary support at that level.
This downturn coincides with crude oil valuations climbing above the $110 mark per barrel. Following President Trump’s statements regarding potential military intervention against Iran concerning Strait of Hormuz passage rights, global financial markets experienced significant volatility, prompting capital flight from higher-risk investments including cryptocurrencies.
BNB’s trading activity surged by 35% over the previous 24-hour period as market participants tested the $580 support region.
At the current $580 valuation, BNB remains 57% below its previous peak of $1,360. This substantial differential underscores the intensity of selling pressure accumulated throughout recent months.

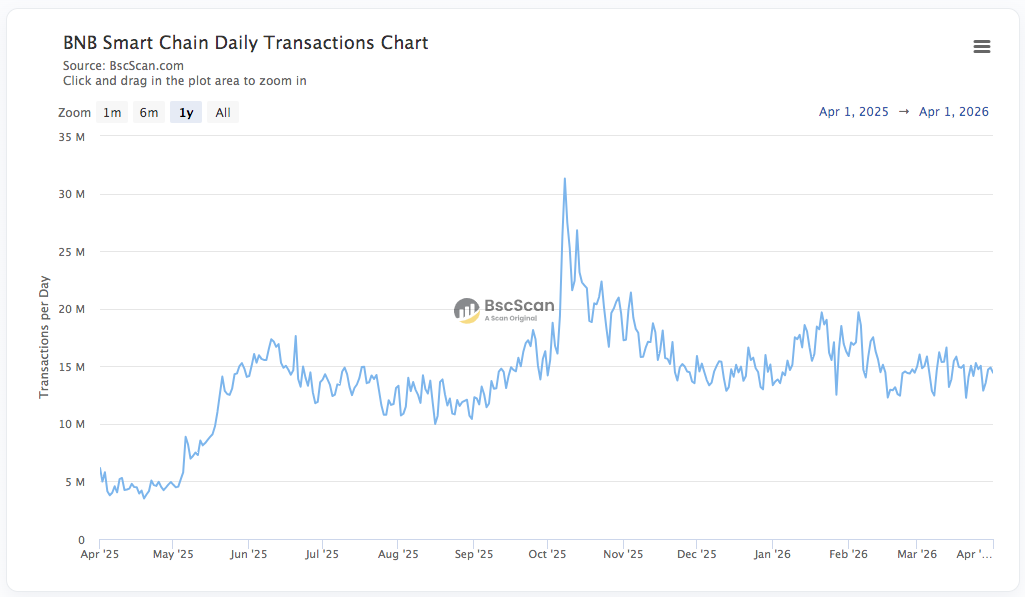
BNB serves two primary functions within its ecosystem: providing trading fee reductions on the Binance exchange and facilitating transaction fees across the BNB Chain network. Blockchain analytics from BSC Scan indicate daily transaction volumes fluctuating between 13 and 19 million, consistent with established patterns.
Bearish Momentum Dominates
Analysis of the daily timeframe reveals BNB has now revisited the $580 support level three times within a two-month span. Multiple tests of identical support zones typically indicate weakening bullish conviction and reduced probability of immediate upward momentum.
The Relative Strength Index measured on the daily interval has fallen below the 40 threshold, a technical development that market analysts typically interpret as a bearish signal.
Federal Reserve policy expectations are contributing additional downward pressure. Current analyst consensus no longer anticipates any interest rate reductions throughout 2026. Just one month prior, approximately 47% of market analysts had projected a rate cut would materialize in June.
Technical Indicators Show Triple Bearish Pattern
Examination of the 4-hour chart structure reveals three consecutive bearish signals have materialized since March 18. The latest signal formed following the conclusion of U.S. trading hours on April 2.
These sequential signals suggest larger institutional participants are actively reducing positions. The 4-hour RSI measurement has entered oversold territory, potentially setting conditions for a temporary relief rally.
Should such a bounce materialize, it may present opportunities for traders seeking short positions before a potential continuation toward the $520 level.
Market analyst Crypto Patel shared observations on X platform noting that BNB had breached the $570 level for the first occasion in more than twelve months. Patel highlighted the $400–$500 range as a strategic accumulation target based on Fibonacci retracement levels at 0.5 and 0.618, referencing historical price action patterns.
BNB currently competes closely with XRP and USDC for the fifth position among cryptocurrencies by total market capitalization, trailing XRP by approximately $1 billion.
The widely referenced Fear & Greed Index currently registers at 9, indicating extreme fear sentiment pervading the broader cryptocurrency marketplace.