
 Stock Plunges Under $80 Amid Rising Iran Conflict Concerns")
Key Takeaways
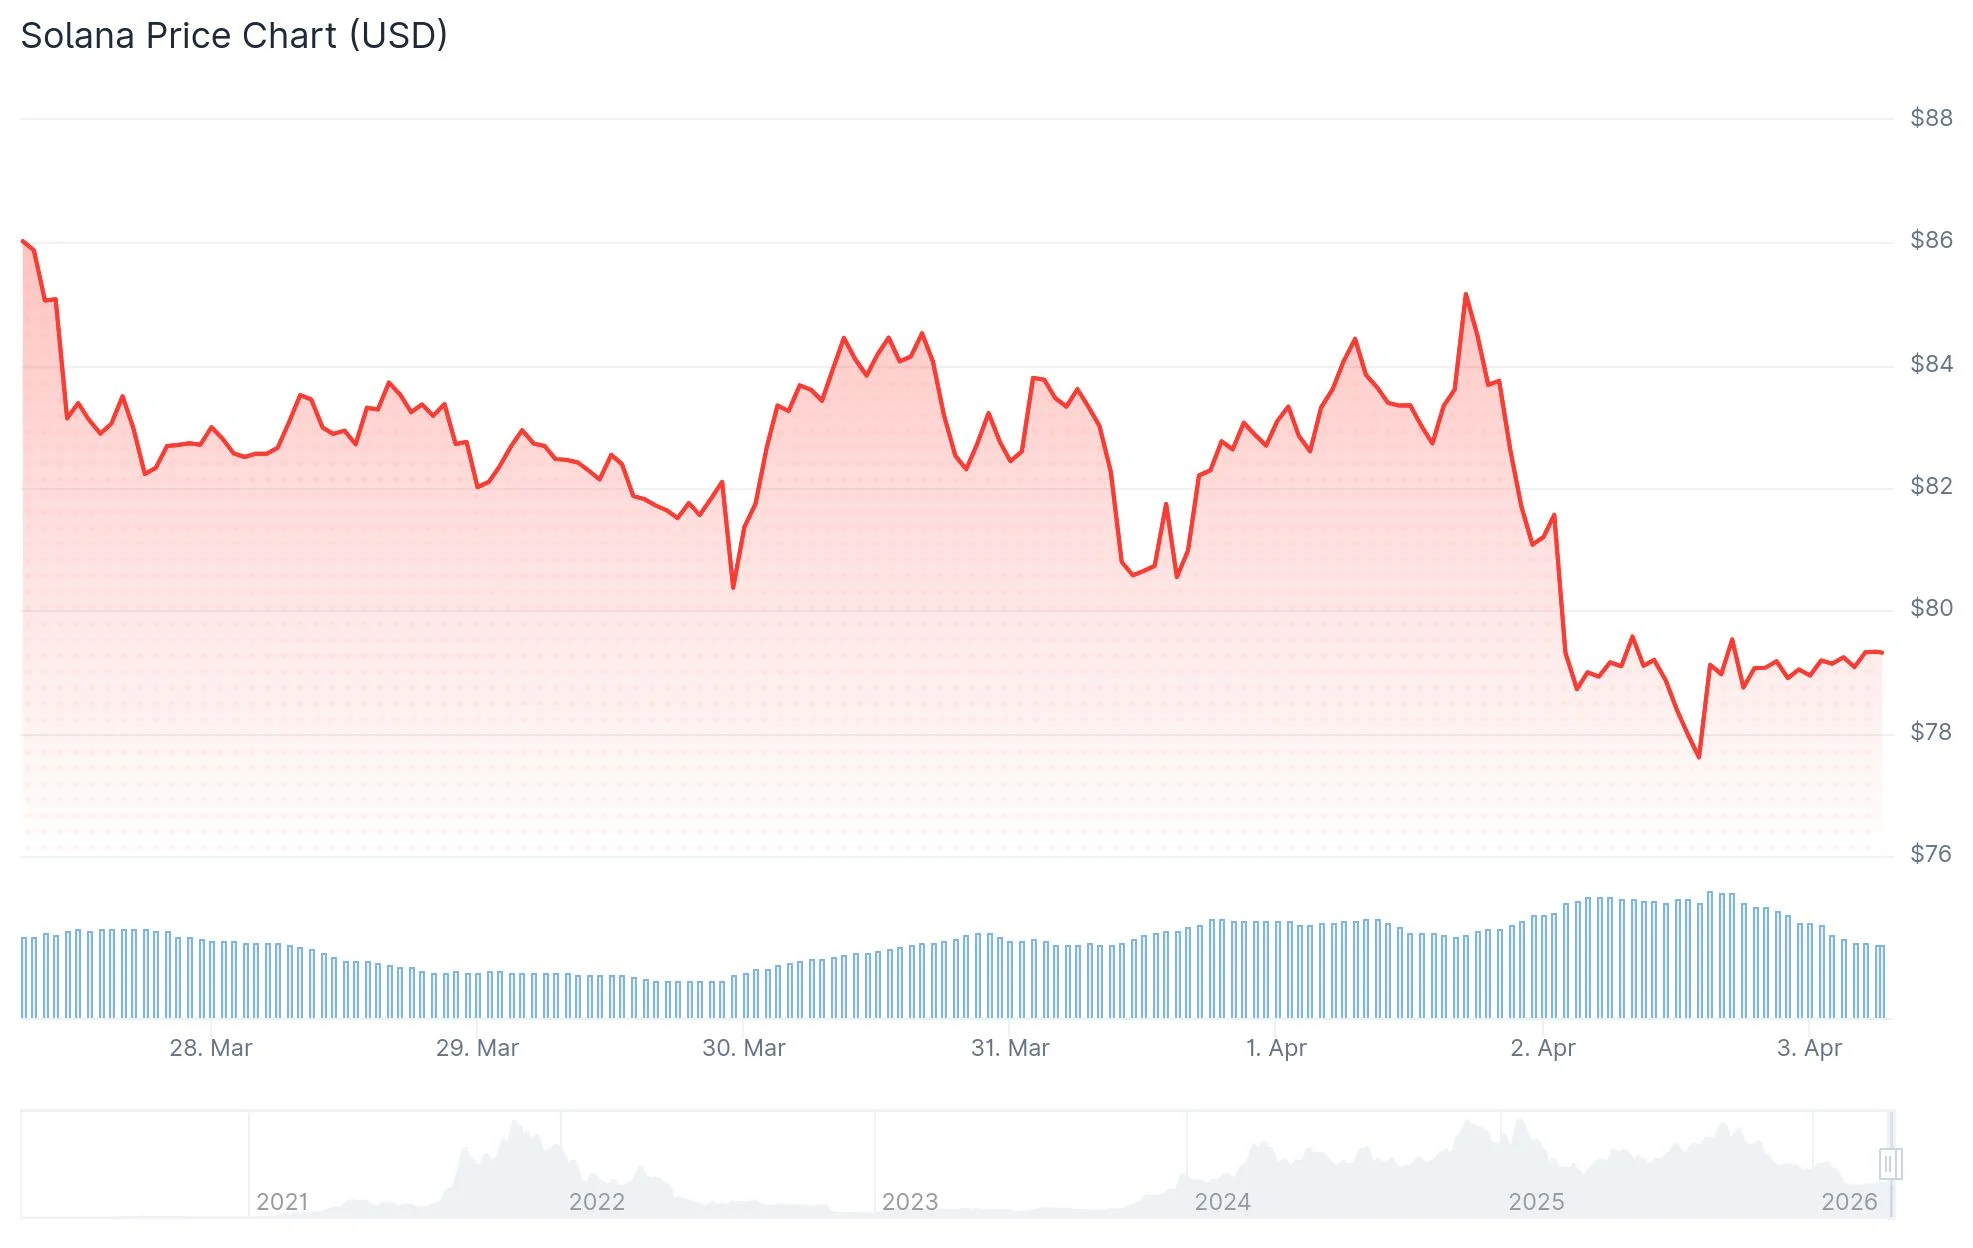
- SOL declined 5.4% beneath the $80 threshold as geopolitical uncertainty from Trump’s Iran warnings fueled market selloffs
- Critical resistance zone established between $82.22 and $85.94; breach below $78 may trigger decline toward $67
- Over $20 million in long positions liquidated within 24 hours, indicating intensifying bearish pressure
- Daily RSI indicator fell beneath 40, validating continuation of downward momentum
- Technical analysts identify $50–$60 range as next significant demand area should current floors collapse
Solana (SOL) experienced a significant downturn throughout the last trading day, plummeting 5.4% to trade beneath the psychologically important $80 level as market sentiment deteriorated across digital assets. The decline was primarily attributed to escalating geopolitical uncertainties, particularly President Donald Trump’s statement regarding plans to strike Iran with extreme force in the near term.
Oil prices surged toward $110 following Trump’s announcement, sparking fresh worries about persistent inflation and causing market participants to reassess their expectations for Federal Reserve interest rate reductions throughout 2026. Risk-on assets including cryptocurrencies typically face headwinds when anticipated monetary easing becomes less certain.
Immediate overhead resistance has formed between $82.22 and $85.94, a zone encompassing multiple Fibonacci retracement levels at 23.6%, 38.2%, and 50.0%. Should price action attempt to recover into this territory, significant selling pressure may emerge unless substantial buying interest materializes.
Trading Activity and Liquidation Data Reveal Intensifying Bearish Forces
Solana’s trading activity surged by 30% during the past day, climbing to approximately $6 billion—representing roughly 13% of the cryptocurrency’s total circulating market capitalization. This dramatic volume increase signals aggressive distribution by market participants.

Liquidated long positions exceeded $20 million throughout this timeframe. Should liquidations surpass $25 million, it would mark one of the most challenging sessions for bullish traders since early February, when SOL collapsed from $100 down to $78.
The daily timeframe Relative Strength Index has descended below the 40 threshold, a technical signal typically associated with strengthening bearish control. Additionally, three consecutive sell indicators materialized on the 4-hour chart, suggesting participation from larger institutional sellers.
A decisive break beneath the $78 support floor would expose the $67 price target, representing approximately a 13% decline from present valuations.
Long-Term Technical Structure Suggests Further Downside
Examining extended timeframes, technical analyst James Easton presented a 14-day chart illustrating SOL confined within a contracting descending channel pattern. The visualization depicts a clear sequence of lower peaks and troughs since reaching its apex during the late 2024 to early 2025 period.
Solana had maintained robust support within the $110–$120 corridor previously, but that zone has now transitioned into a resistance barrier. Market analysts emphasize that inability to recapture the $100–$110 territory maintains downside vulnerability, with $60 and subsequently $50 marked as the following substantial accumulation areas.
Each rally attempt thus far has proven unsuccessful in breaking the established pattern of declining highs. With long liquidations surpassing $20 million in just the last 24-hour period, short position holders maintain tactical advantage provided the $78 level fails to hold.