
 Stock: Exchange Withdrawals Spike Despite Persistent Bearish Chart Patterns")
Key Takeaways
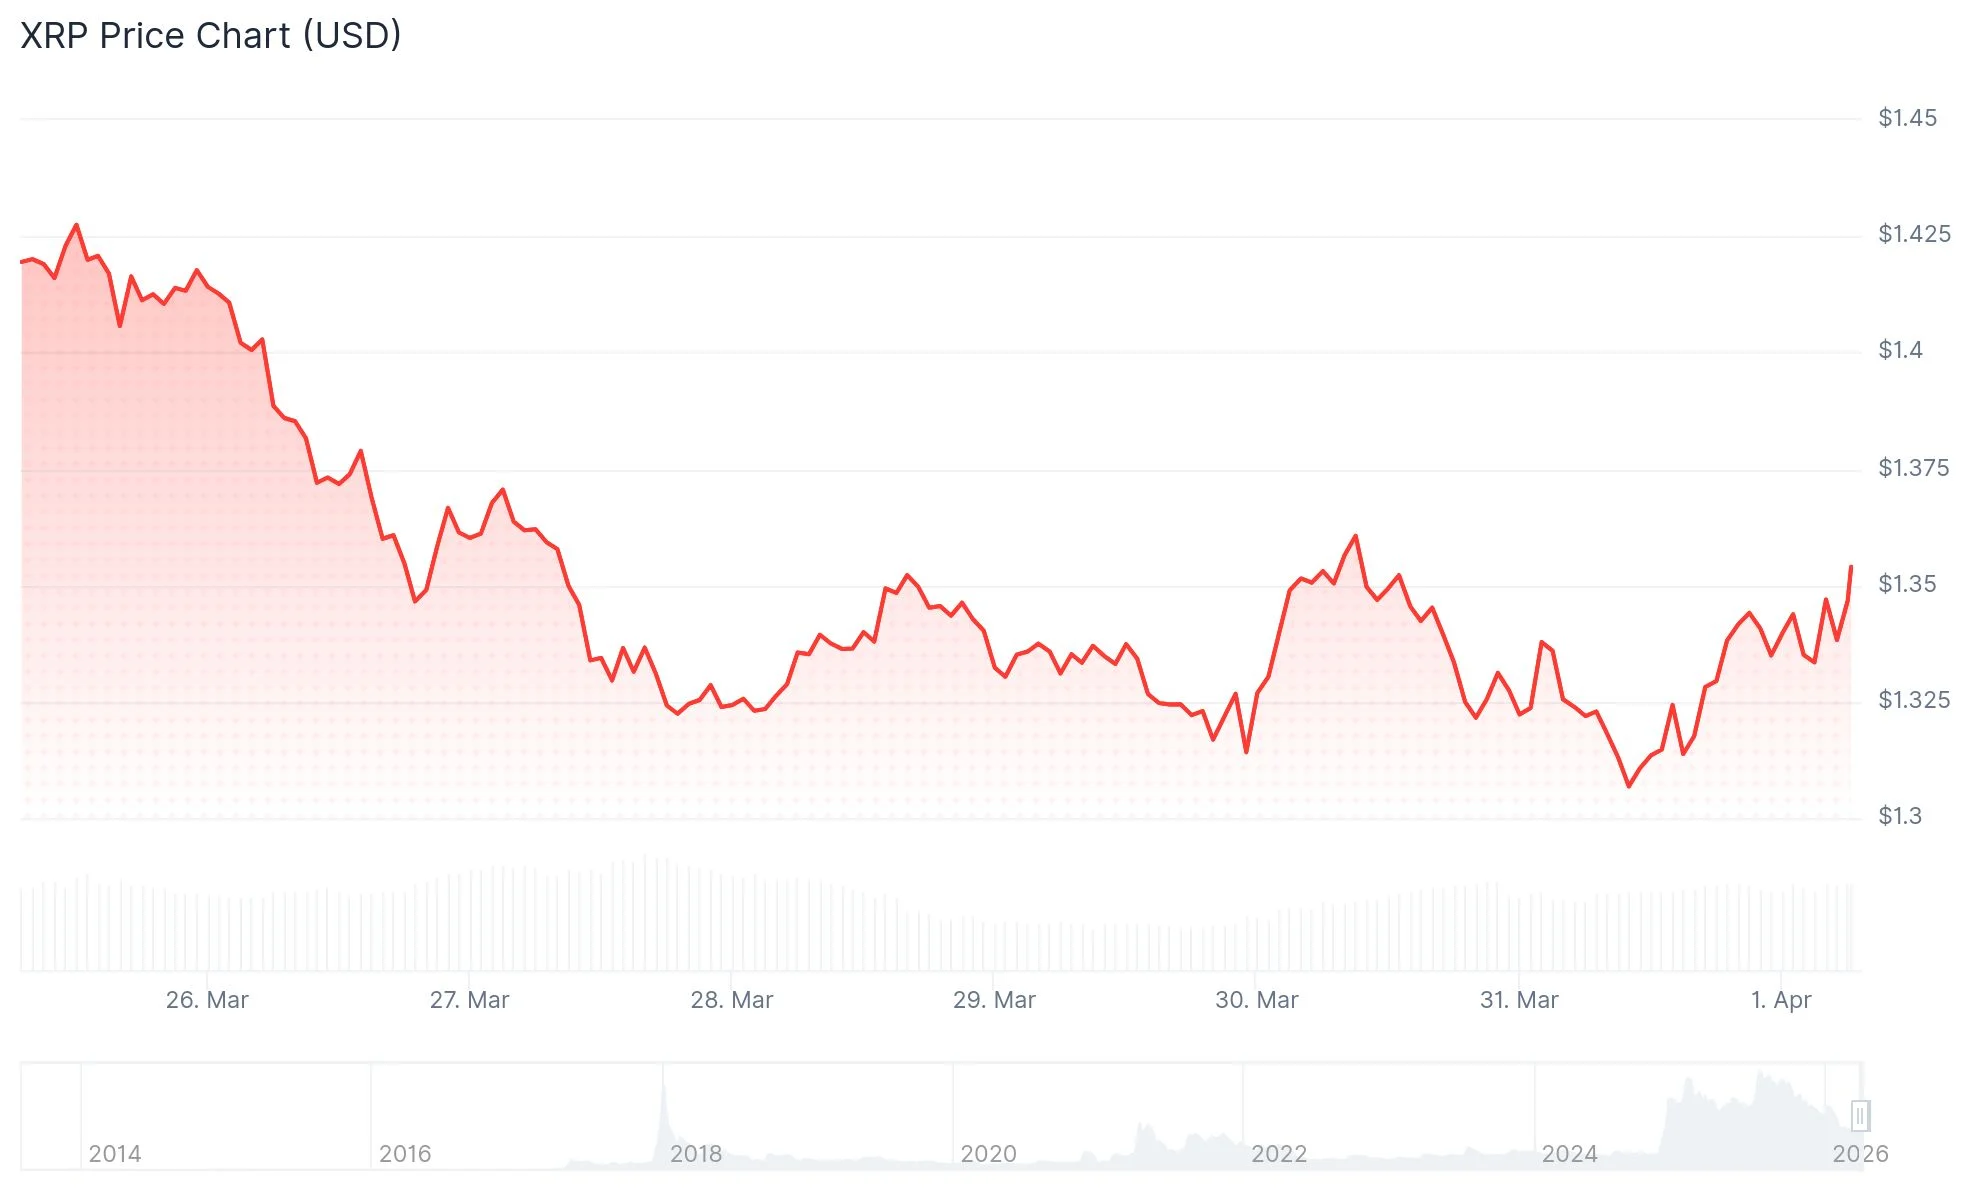
- XRP maintains a position around $1.33, defending the $1.30–$1.35 support zone following a significant pullback from $2.40 highs
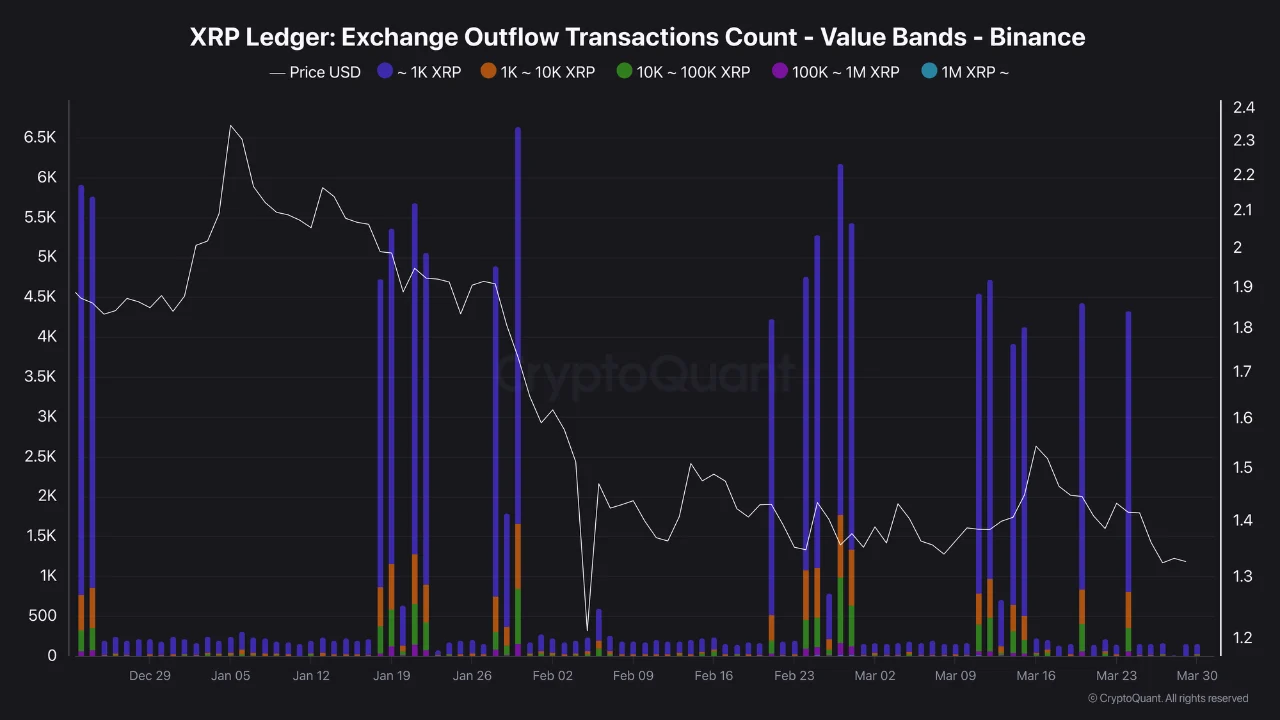
- Exchange withdrawal activity on Binance has spiked dramatically since late February, with daily transactions occasionally exceeding 6,000 events
- Most withdrawal transactions fall within the 1,000–100,000 XRP bracket, suggesting mid-tier investors are transferring assets to cold storage
- Technical indicators show XRP trading beneath its 50, 100, and 200-day moving averages, with $1.50 representing critical overhead resistance
- Market analyst Ali Charts has identified a potential ascending triangle formation that might indicate an upcoming buying window
XRP continues to hold its ground at $1.33, maintaining position above a crucial support threshold around $1.30 following an extended downtrend from approximately $2.40 earlier in the year. For several months now, the digital asset has consolidated within a tight $1.30–$1.50 corridor, displaying relative resilience compared to numerous altcoins that have descended to or approached historical lows.
Despite this stability, XRP remains approximately 60% underwater from its record peak. The overarching market sentiment continues to lean bearish, with the asset trading underneath its 50, 100, and 200-day exponential moving averages — all exhibiting downward trajectories.
The Relative Strength Index registers around 41 on the daily timeframe, reflecting subdued momentum conditions. Meanwhile, the MACD indicator hovers just beneath the signal line near neutral territory, suggesting weakening buying interest rather than genuine bullish reversal signals.
Yet beneath the surface of these discouraging chart patterns, blockchain analytics from researcher Darkfost paint a contrasting narrative. Beginning in late February, XRP withdrawal transactions from Binance have experienced a notable acceleration. Several trading days have logged upwards of 4,000 outflow events, with isolated peaks approaching 6,000 withdrawals.

Exchange Withdrawals Indicate Strategic Accumulation
These withdrawal patterns don’t represent concentrated whale movements. Instead, the activity disperses across thousands of separate transactions ranging from 1,000 to 100,000 XRP — a segment typically associated with retail enthusiasts, mid-sized holders, and smaller institutional participants.
This distribution pattern implies investors are systematically relocating XRP from centralized exchanges into self-custody solutions. Withdrawing tokens from exchange inventories effectively diminishes the immediately available supply for selling, potentially reducing downward price pressure over extended periods.
Darkfost characterizes this behavior as indicative of methodical accumulation rather than distribution or capitulation. The coins are departing exchange wallets and failing to reappear on public order books.
The $1.25–$1.30 price floor has withstood repeated downside tests without yielding. Market participants seem willing to absorb selling pressure at these levels, representing a meaningful departure from the asset’s previous cascading decline.
Critical Price Thresholds Under Observation
The $1.50 resistance level has successfully rejected every upward push since February. Penetrating above this threshold would constitute the initial confirmation of potential trend reversal. Additional resistance emerges around $1.81, marking the upper boundary of the prevailing descending channel formation.
Conversely, a breakdown below $1.25 would likely expose the psychologically significant $1.00 region as the subsequent major support destination.
Market analyst Ali Charts highlighted on X that should XRP indeed be constructing an ascending triangle configuration, this development could present a near-term entry opportunity while potentially signaling a more substantial long-term bullish trajectory.
XRP’s spot price stood at $1.33 as of Wednesday, April 1, 2026.