
 Stock Faces Potential Drop to $1,800 as Bulls Lose Momentum")
TLDR
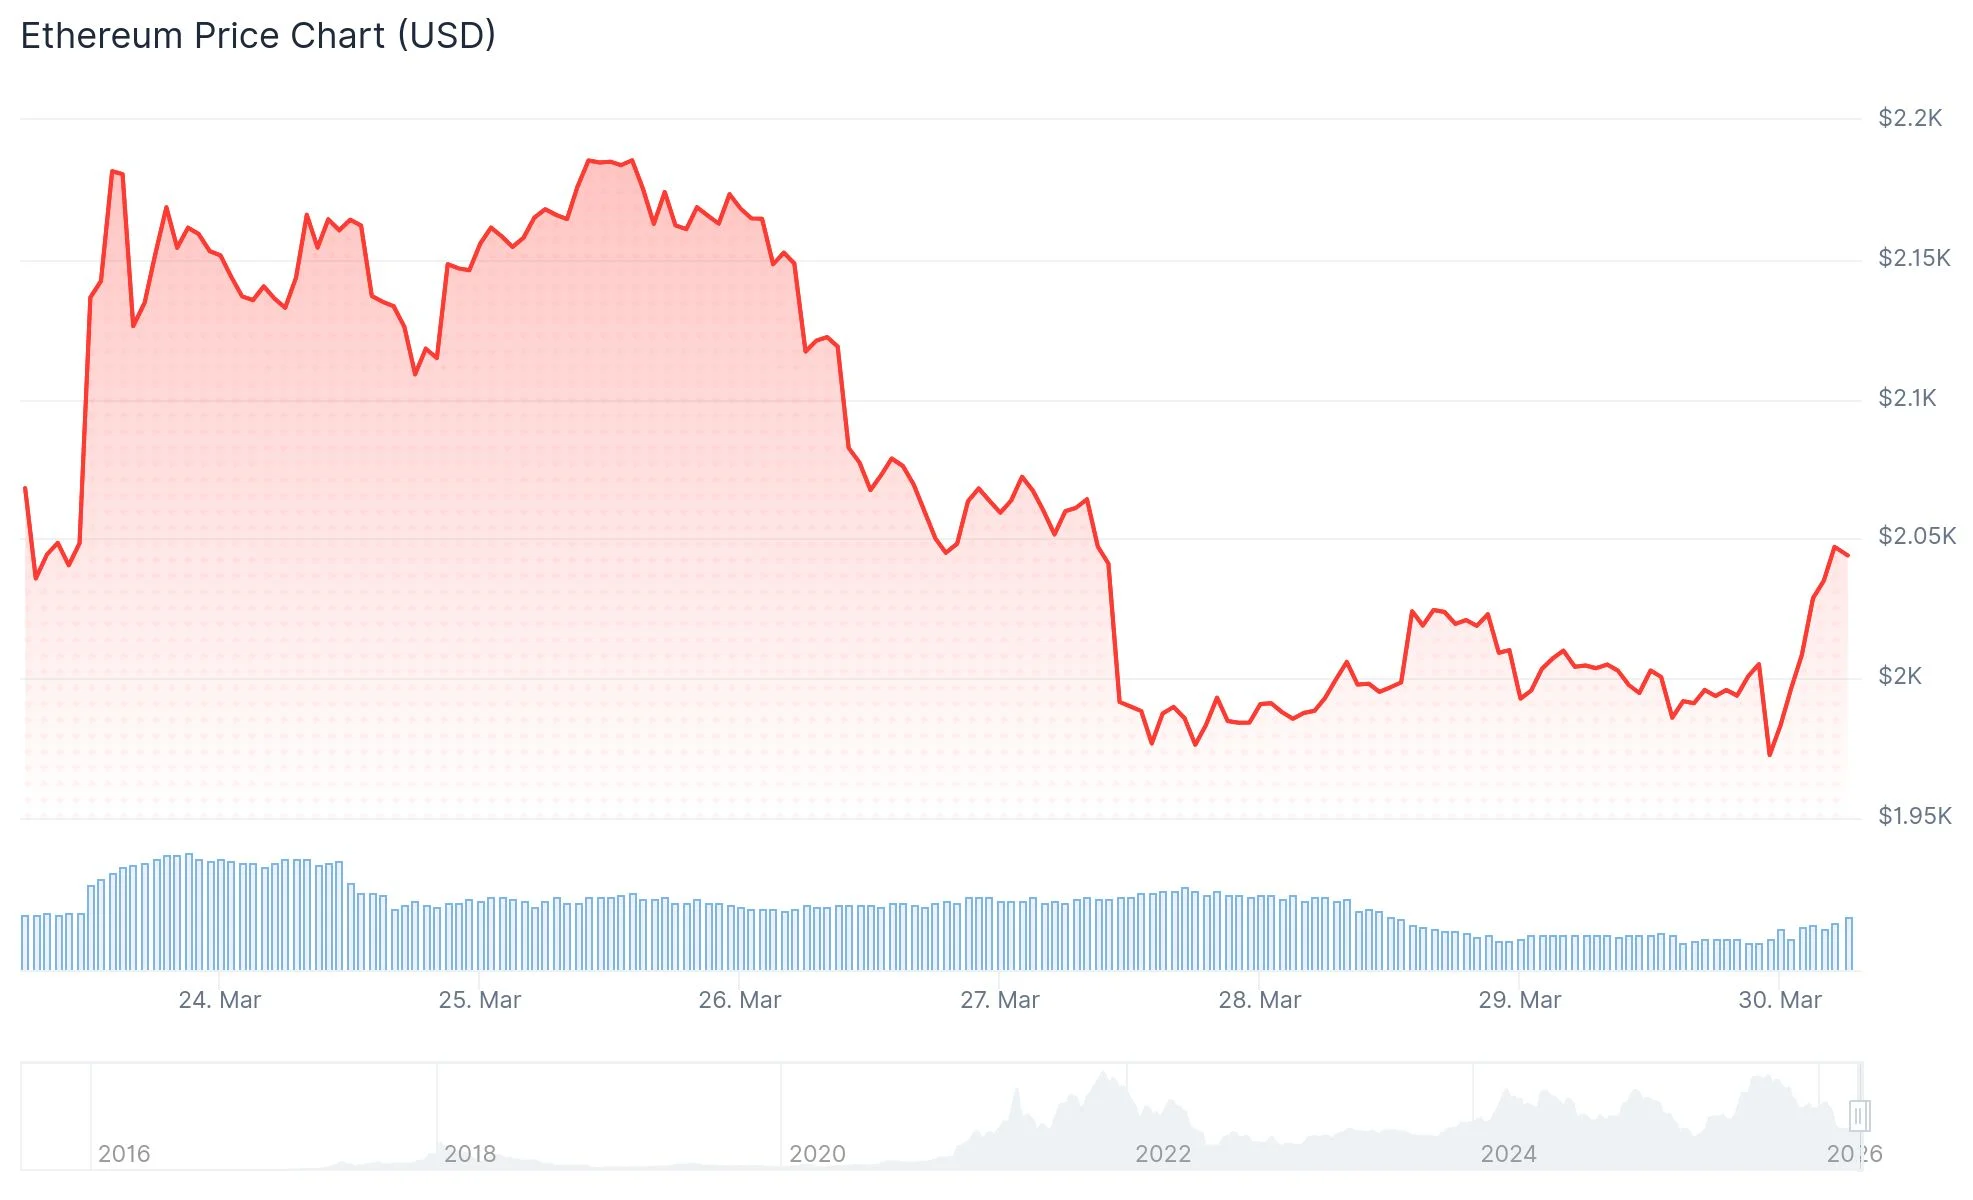
- Ethereum is clinging to the $2,000 zone following a rejection near $2,372 in early March.
- Long/short positioning has surged to 2.4, creating potential squeeze conditions as price action stalls.
- Ethereum ETFs listed in the U.S. experienced $92.5 million in redemptions on March 26.
- Market volatility increased from a massive $14.16 billion Bitcoin options settlement and geopolitical uncertainty.
- Critical overhead resistance exists between $2,138 and $2,151, while a breach of $1,980 may trigger deeper declines.
Ethereum is currently hovering around the $2,048 mark as buyers attempt to defend the psychologically important $2,000 threshold. After climbing earlier this month, the cryptocurrency encountered strong selling pressure around $2,372. Following that rejection, ETH has remained confined within a narrow trading corridor between $1,900 and $2,200.
The current price level sits beneath the 50-day exponential moving average, which hovers near $2,160, and substantially below the 100-day EMA positioned around $2,420. This technical configuration suggests a bearish market structure remains intact.
The daily Relative Strength Index reads approximately 44, registering below the midpoint of 50 that typically separates bullish from bearish territory. Meanwhile, the MACD indicator trades beneath its signal line and is gravitating toward the zero threshold. These technical readings collectively signal diminishing upward momentum.
A notable development catching traders’ attention is the long/short ratio, which has expanded to approximately 2.4. This indicates that speculative positioning is heavily skewed toward bullish bets. However, price performance hasn’t validated this optimism.

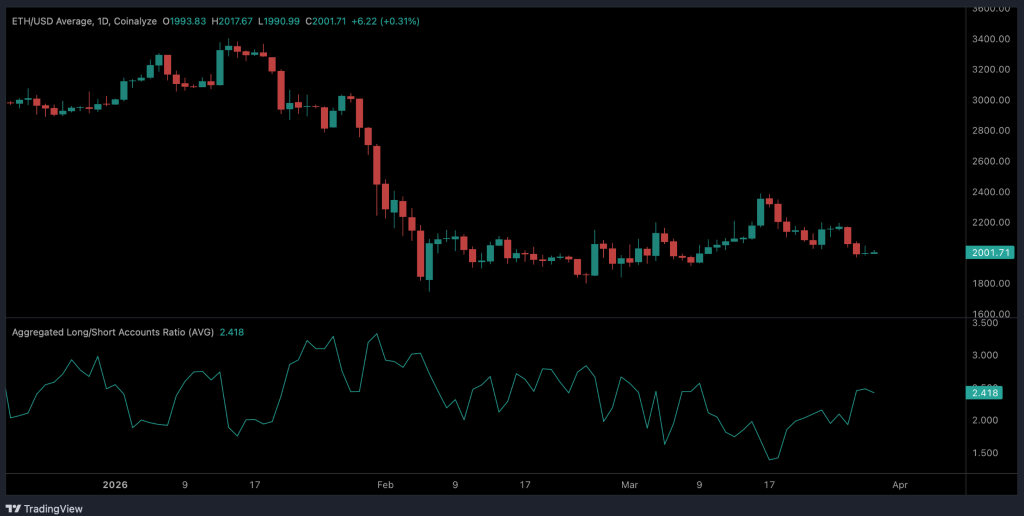
When leveraged long positions accumulate while price action remains stagnant or declines, it establishes conditions for what market participants refer to as an overcrowded trade. Such scenarios frequently result in long squeezes—events where sudden downward price movement triggers cascading liquidations, amplifying the selloff.
ETF Outflows and Market Pressure
Ethereum exchange-traded funds in the United States registered $92.5 million in net outflows on March 26. This withdrawal was part of a broader redemption trend affecting cryptocurrency investment products.
The previous day witnessed the expiration of a historic $14.16 billion in Bitcoin options contracts on March 27. Major options expirations typically inject volatility into markets, and this particular event contributed to heightened selling activity throughout the digital asset sector.
Macro-level developments also influenced market sentiment. Escalating crude oil prices, driven by Iran’s warnings regarding potential shipping route disruptions, intensified inflation worries. Such environments generally create headwinds for speculative assets including Ethereum.
Key Levels to Watch
For upward movement, traders are monitoring $2,138, which represents the 23.6% Fibonacci retracement calculated from the peak of $3,402 to the trough at $1,747. The Ichimoku Kijun indicator registers at $2,151, and a decisive close above this technical zone could potentially catalyze a rally toward $2,380.
Regarding downside targets, $1,990 represents the immediate support threshold. Below this level, the channel base emerges near $1,748. A confirmed breakdown beneath that area would likely perpetuate the bearish trend.
Technical projections for the upcoming five trading sessions suggest ETH will likely remain range-bound between $1,980 and $2,170, with probability models assigning less than a 20% chance of upward price movement.
Market analyst Ali Charts shared on X that Ethereum is approaching a “major test at $1,800,” indicating that some market observers anticipate substantially lower price levels if current support zones fail.
Analyst Tom Lee has expressed a long-term bullish outlook, projecting Ethereum could eventually reach $62,000, although no specific timeframe accompanied this ambitious forecast.
Ethereum ETF redemptions amounted to $92.5 million on March 26 as the cryptocurrency maintained its position near $2,000, with technical indicators suggesting ongoing near-term vulnerability.