
 Stock Plunges Under $2,000 Amid $392M ETF Exodus")
Key Highlights
- ETH plummeted beneath the $2,000 threshold with a 5% decline in 24 hours and 6% weekly loss
- Exchange-traded funds for Ethereum witnessed an unbroken streak of seven days in net withdrawals amounting to $392 million
- Market demand for ETH reached its weakest point since November 2024
- Critical price floor established at $1,911, while technical analysts monitor $1,750 as the subsequent major threshold
- Total ETH holdings on exchanges declined from 22 million tokens in 2023 to approximately 15 million
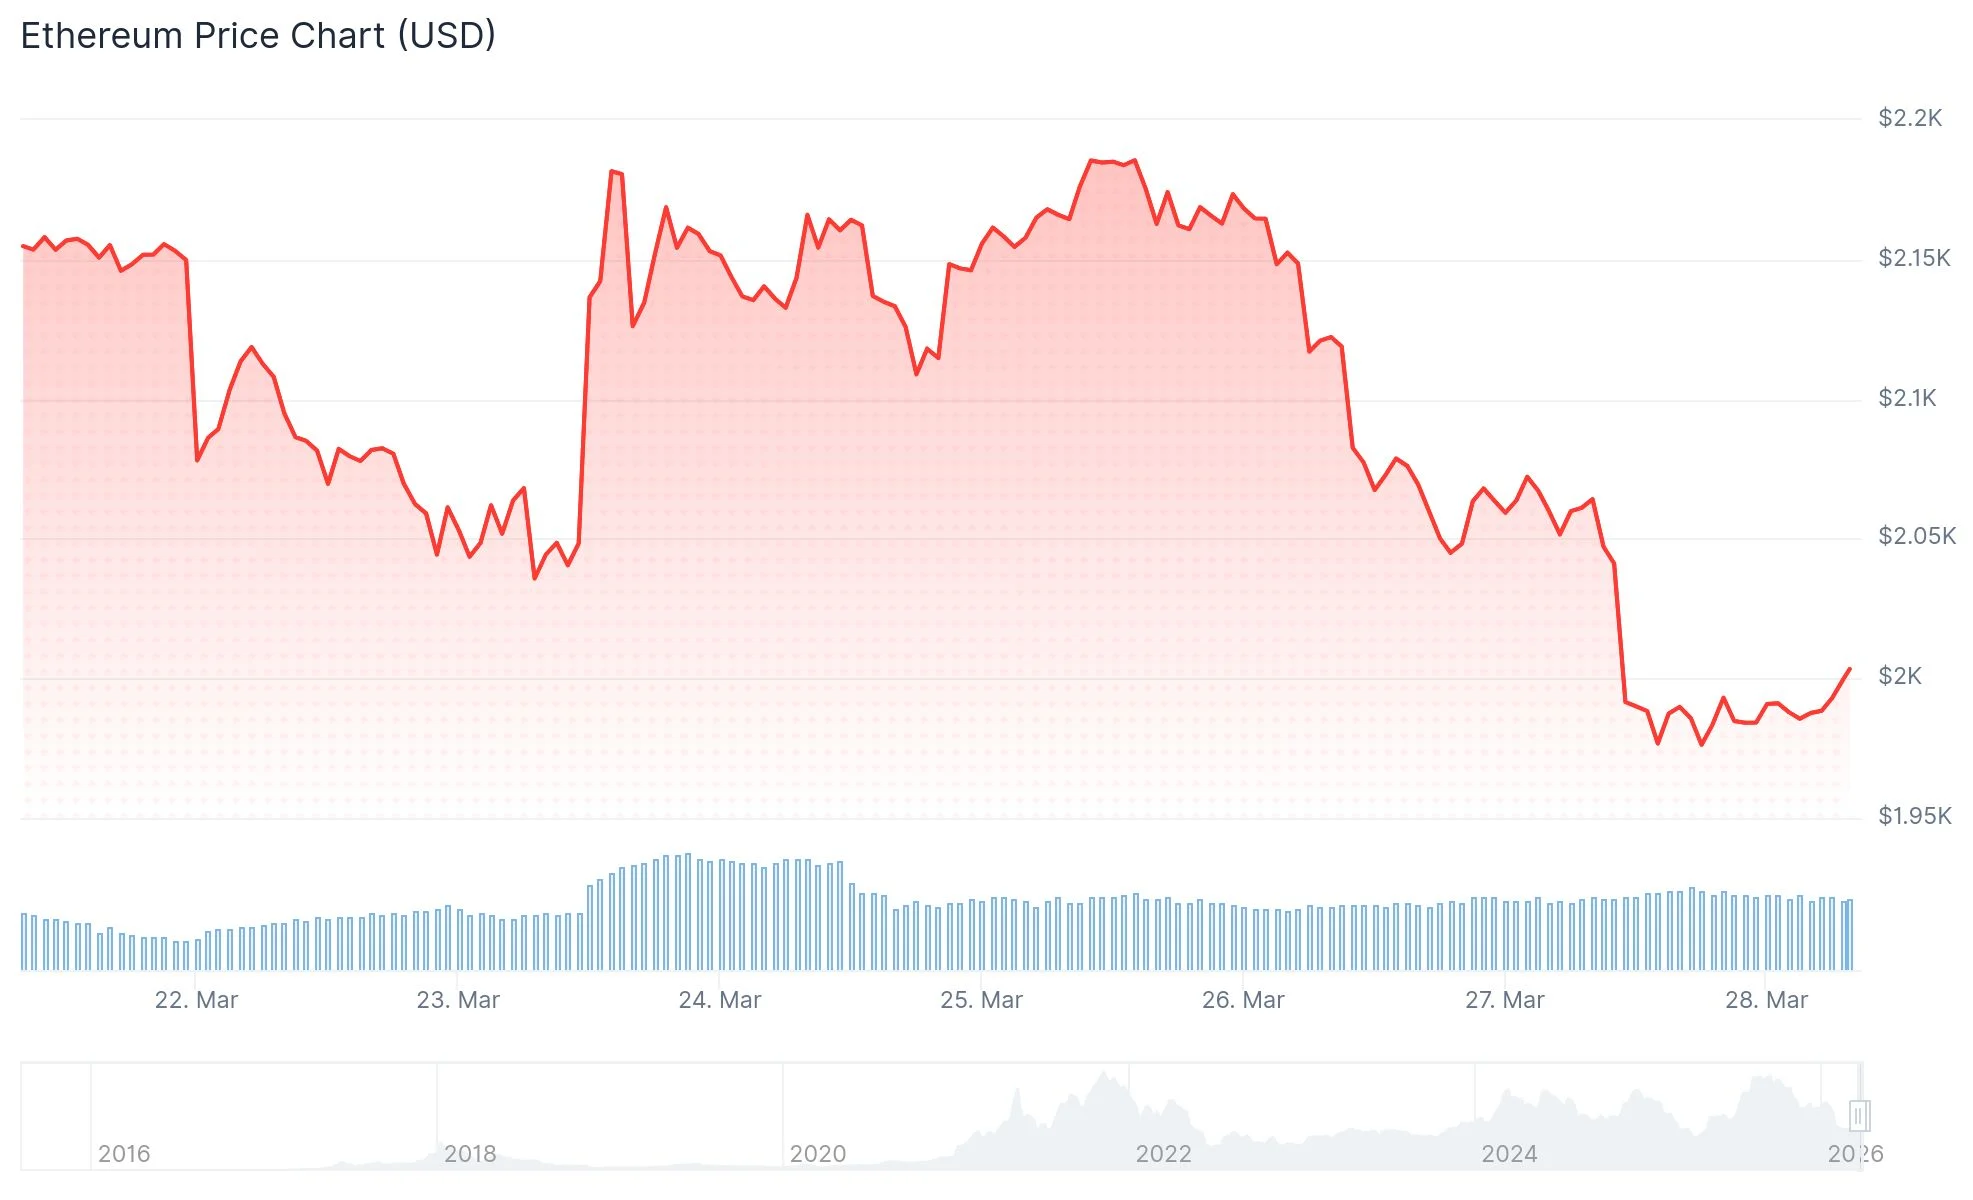
The second-largest cryptocurrency by market capitalization breached the psychologically important $2,000 level on Friday, March 27, 2026. This price action resulted in leveraged long positions worth over $111 million being forcibly closed within a 24-hour window, based on analytics from Coinglass.
The decline amplified ETH’s seven-day losses to 6%, turning the monthly performance negative for the first time this quarter.
Escalating geopolitical tensions contributed to the selloff. Iran’s Islamic Revolutionary Guards Corps delivered public threats directed at personnel working in industrial facilities across Israel and Gulf nations, signaling an impending counterattack. These developments came after coordinated US-Israeli operations targeted Iranian industrial infrastructure, intensifying global risk-off sentiment across financial markets.
Institutional appetite for Ethereum has evaporated rapidly. Exchange-traded fund products tracking spot ETH prices registered an unprecedented seven consecutive trading sessions of capital exits, accumulating approximately $392 million in total withdrawals. This institutional retreat, previously considered essential for sustainable price appreciation, has completely reversed.

Market commentator Ted Pillows highlighted on X that daily ETH ETF redemptions hit $92.5 million, with asset management giant BlackRock responsible for $43.2 million in Ethereum sales alone.
Retail participation has similarly deteriorated. The Coinbase Premium Index descended deeper into negative readings, indicating American-based traders are actively liquidating positions or maintaining cautious distance from the market.
Analytics provided by Capriole Investments reveal that measurable demand for ETH has registered negative values throughout March, marking the weakest reading in 16 months.
Chart Analysis Signals Further Downside
Examining the daily timeframe, ETH currently trades beneath its 20-day exponential moving average. The 50-day and 100-day EMAs remain significantly elevated at $2,180 and $2,430 respectively, confirming the prevailing trend continues its corrective phase.
Technical analyst CryptoWZRD highlighted that when price settled below $2,200 in the previous week, it served as an initial alert signal preceding “additional weakness.” Following the breakdown of both $2,100 and $2,000 support zones, attention now shifts to the $1,750–$1,850 region.
Chartist CyrilXBT published technical analysis demonstrating ETH trading considerably below its 200-day EMA positioned near $2,766. He cautioned that failure to hold the $1,750 floor could accelerate downward momentum toward the $1,400–$1,500 range.
On-Chain Metrics Present Conflicting Signals
One divergent indicator emerges from exchange balance data. CryptoQuant statistics shared by blockchain analyst James Easton reveal that Ethereum balances on centralized platforms have contracted from exceeding 22 million in 2023 to roughly 15 million ETH currently. Easton characterized this activity as major holders “stacking and staking.”
Nevertheless, declining exchange inventories independently cannot guarantee price reversal. While the metrics confirm tokens migrating off platforms, they don’t necessarily validate accumulation strategies.
Regarding institutional accumulation, BitMine Immersion-associated wallets acquired 117,111 ETH across a three-day period, according to blockchain tracker Lookonchain. The organization had previously disclosed purchasing 65,341 ETH.
ETH futures open interest climbed to 14.72 million ETH, despite funding rates flipping negative across perpetual swap markets.
Near-term price support establishes at $1,911, with secondary support positioned at $1,741. A decisive close beneath $1,741 would validate continuation of the existing bearish trajectory.