
 Stock Faces Downward Pressure After $93 Rejection Triggers Bearish Flag Formation")
Key Takeaways
- Solana experienced a sharp rejection at the $93 price level, resulting in a 5.7% decline over 24 hours to approximately $87
- The cryptocurrency is positioned beneath all major moving averages (20-day, 50-day, 100-day, and 200-day)
- Technical momentum signals (RSI, MACD) indicate diminishing bullish strength
- A developing bearish flag formation on daily charts suggests potential downside movement to the $40–$45 zone
- Despite price weakness, Solana’s network handled 44% of worldwide cryptocurrency transactions
Solana (SOL) is experiencing significant selling pressure following its inability to overcome the $93 resistance barrier. The cryptocurrency has retreated to a critical support area that market participants are monitoring intently.
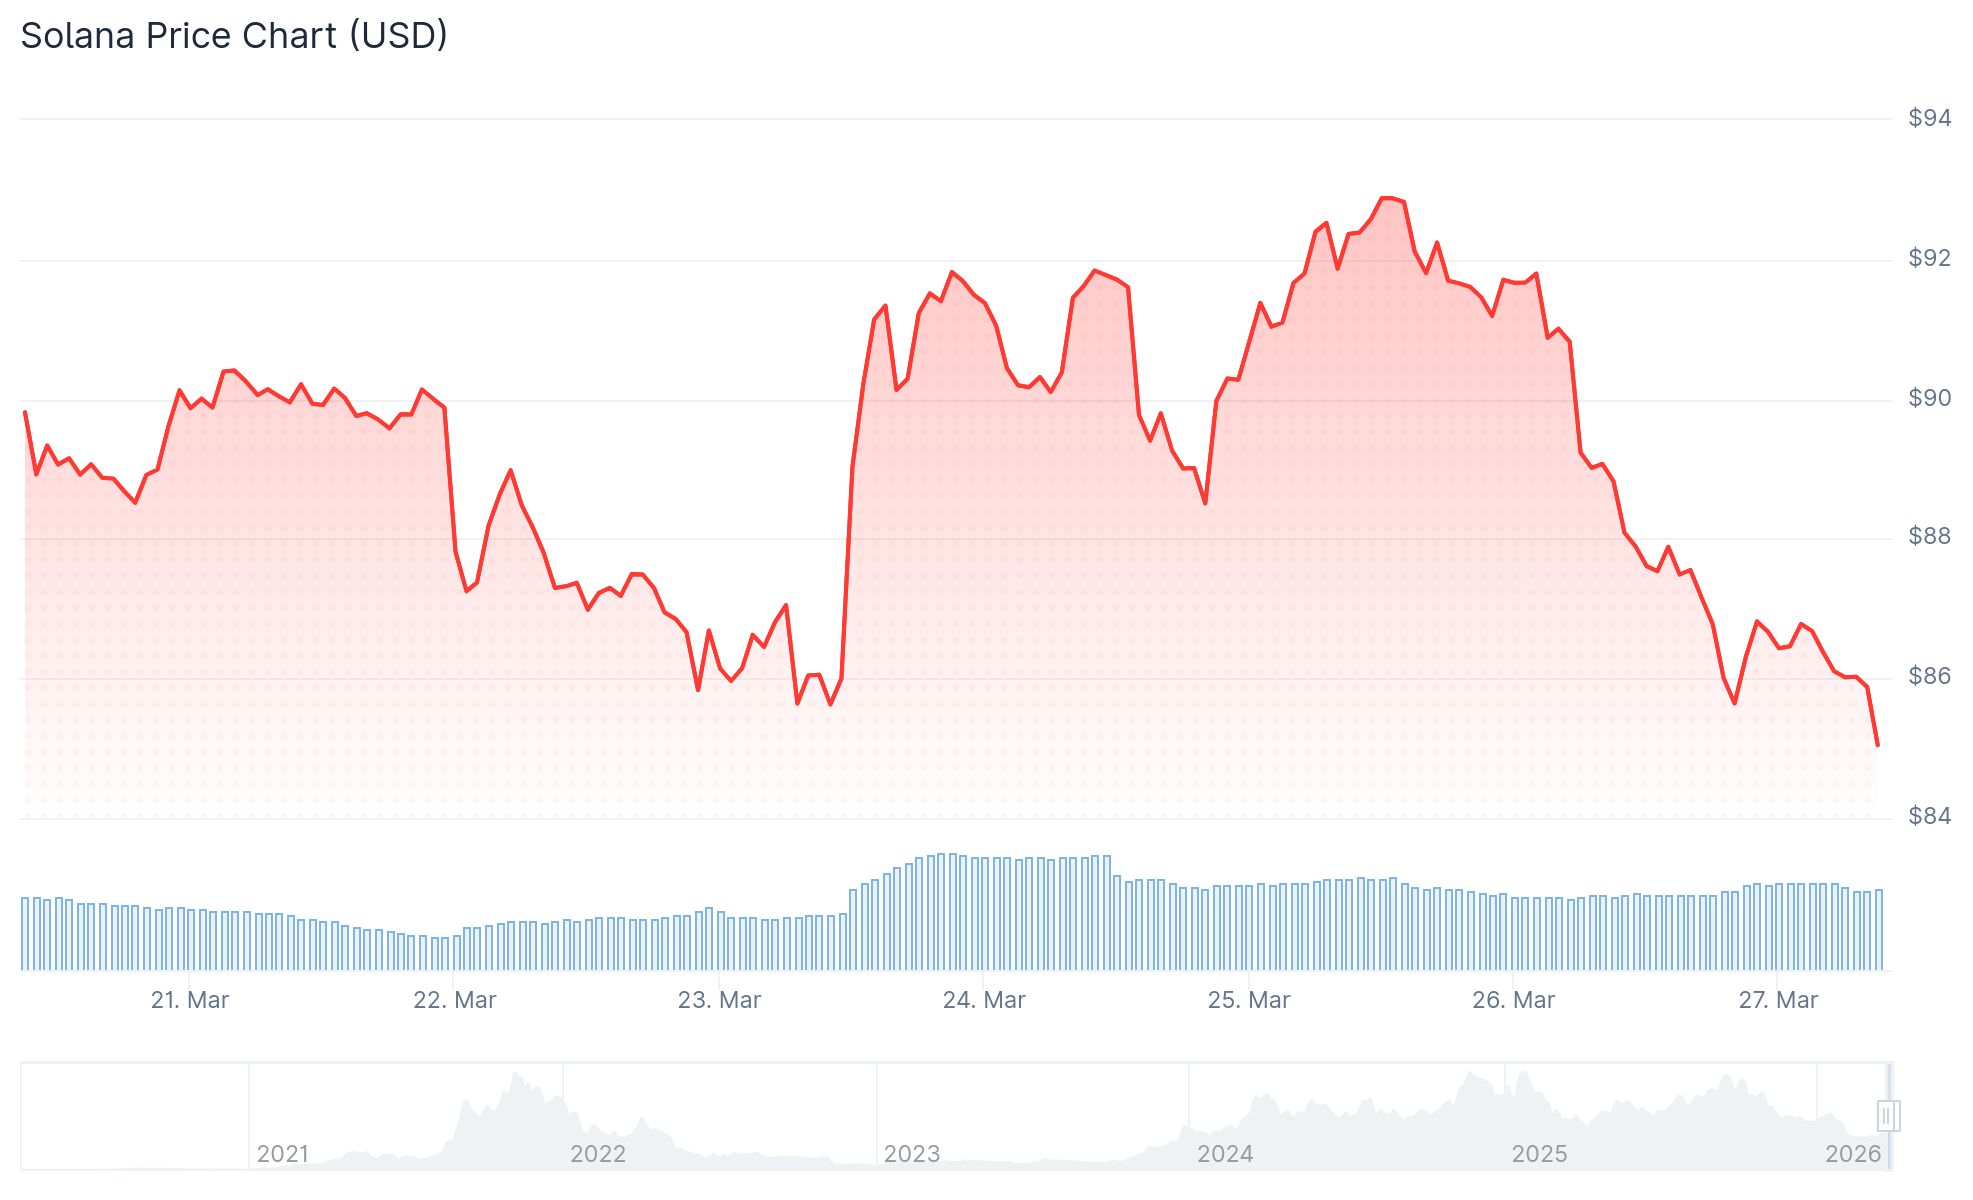
Currently, SOL is changing hands at $87.45. The 24-hour trading volume registers at $5.62 billion, while the overall market capitalization stands at $50.21 billion. The asset has experienced a 5.70% price reduction within the last day.
The failed attempt to breach $93 was highlighted by cryptocurrency analyst BitGuru through a post on X dated March 26, 2026. The analyst noted that SOL has reverted to a significant historical support area following the unsuccessful resistance challenge. The price action at this juncture may determine the next directional movement.
Should demand materialize at this level, SOL might stage a recovery toward upper resistance zones. Conversely, a breakdown of this support area could trigger additional downside movement.

Technical Momentum Reveals Growing Weakness
Solana currently trades beneath every major moving average benchmark. The 20-day moving average registers at $88.63, the 50-day stands at $86.09, the 100-day positions at $106.54, and the 200-day reaches $143.24.
Trading below both the 100-day and 200-day moving averages demonstrates the cryptocurrency’s distance from any meaningful bullish trend.
The RSI measurement shows 47.66, positioned below its signal threshold of 52.54. The MACD indicator reads 0.127, underneath its signal level of 0.232. The neutral MACD histogram suggests minimal directional momentum in either trajectory.
Emerging Bearish Flag Formation Signals Potential Downside
Analysts have spotted a bearish flag configuration developing on the daily timeframe — a technical setup resembling a previous pattern from earlier this year. During that earlier occurrence, Solana experienced a substantial breakdown following pattern completion.
The present formation displays price action consolidating within an ascending channel following a pronounced decline. Should a breakdown materialize from present levels, technical projections point toward the $40 to $45 territory within a one to two-week timeframe.
Regardless of price deterioration, Solana’s blockchain activity demonstrates robust performance. The network facilitated 825,729,338 transactions from a total of 1,867,616,231 blockchain transactions during the tracking period — representing 44% of all worldwide cryptocurrency transaction volume.
Cryptocurrency analyst Ali Charts emphasized on X that more than 100 million SOL tokens were exchanged between $91.45 and $82.60, identifying this as the most crucial demand area. Beneath this zone, significant price levels to monitor include $53.10, $35.40, and $23.60.