
 Stock Maintains Uptrend as Real-World Asset Value Surges Past $1.8 Billion")
Key Highlights
- Solana maintains position near $88, defending critical trend line support following retreat from $95 peak
- Market sentiment indicator plunged to 30 (Fear territory) after Powell’s remarks regarding Iran conflict economic uncertainties
- Network activity exceeded 880 million transactions in the past week, though fee generation remains modest at $4.6 million
- Platform’s tokenized real-world asset sector has grown beyond $1.82 billion, with DeFi TVL in RWA protocols reaching $465 million
- Technical analysts identify $50–$80 corridor as critical accumulation territory, projecting potential rallies to $500–$1,000 range
Solana continues trading near the $88 mark following a recent decline from $95 highs. The cryptocurrency is currently testing a critical trend line that market participants are monitoring for directional cues.
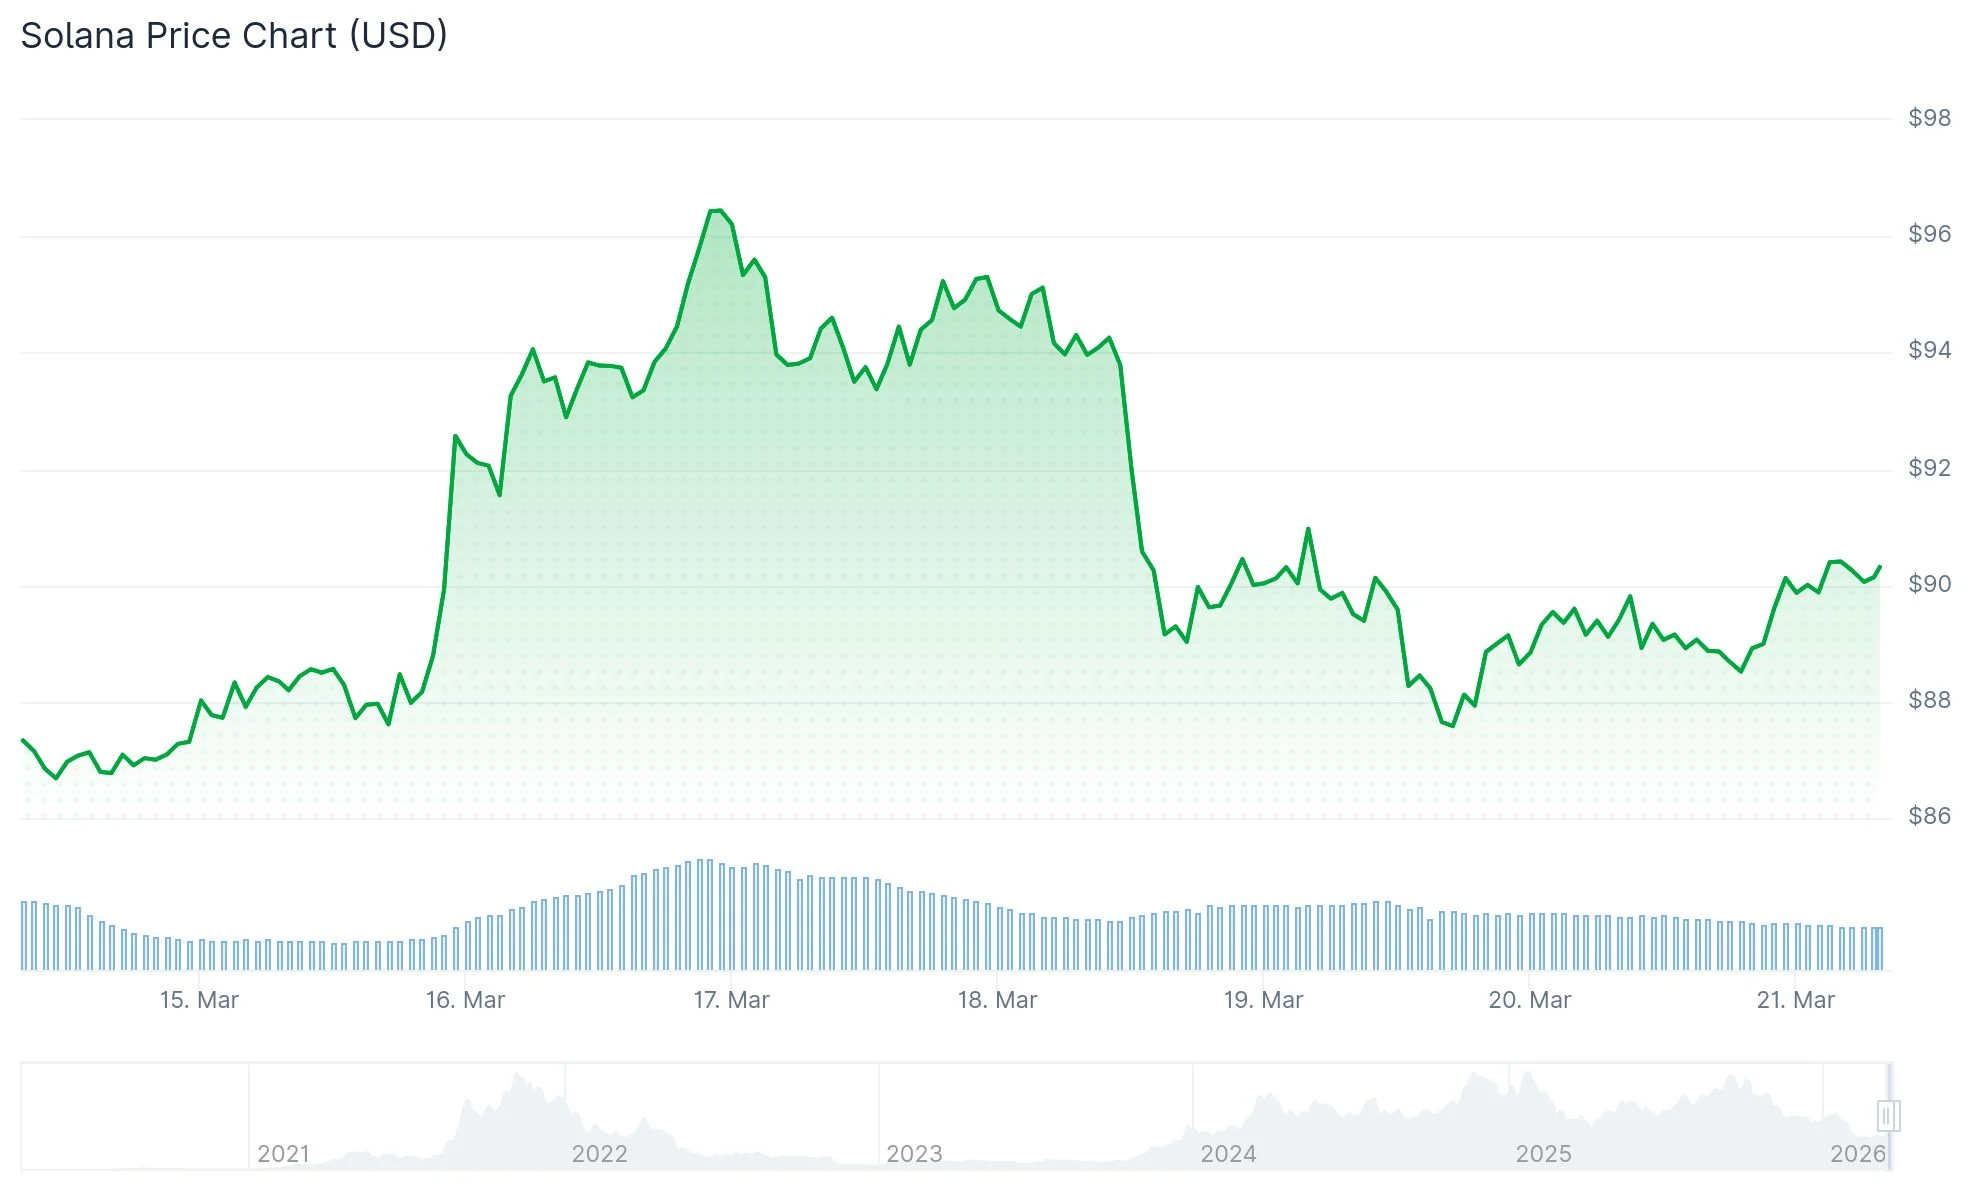
Daily trading volume has contracted to $3.3 billion, marking a significant decline from the $6.5 billion recorded on March 16 when SOL momentarily reached $95. Market participants appear to be securing profits during upward movements as overall cryptocurrency market conditions become increasingly cautious.
The cryptocurrency sentiment gauge declined from 46 (Neutral territory) to 30 (Fear zone) following Federal Reserve Chairman Jerome Powell’s statement regarding “uncertain” economic consequences stemming from the Iran conflict. Rising oil costs could trigger inflationary pressures, potentially forcing the Fed to postpone or abandon planned interest rate reductions throughout 2025.
Network Usage Versus Revenue Generation
The Solana blockchain handled more than 880 million transactions during the previous seven-day period. This figure approaches the network’s all-time peak of 959 million transactions recorded in the week concluding February 8.

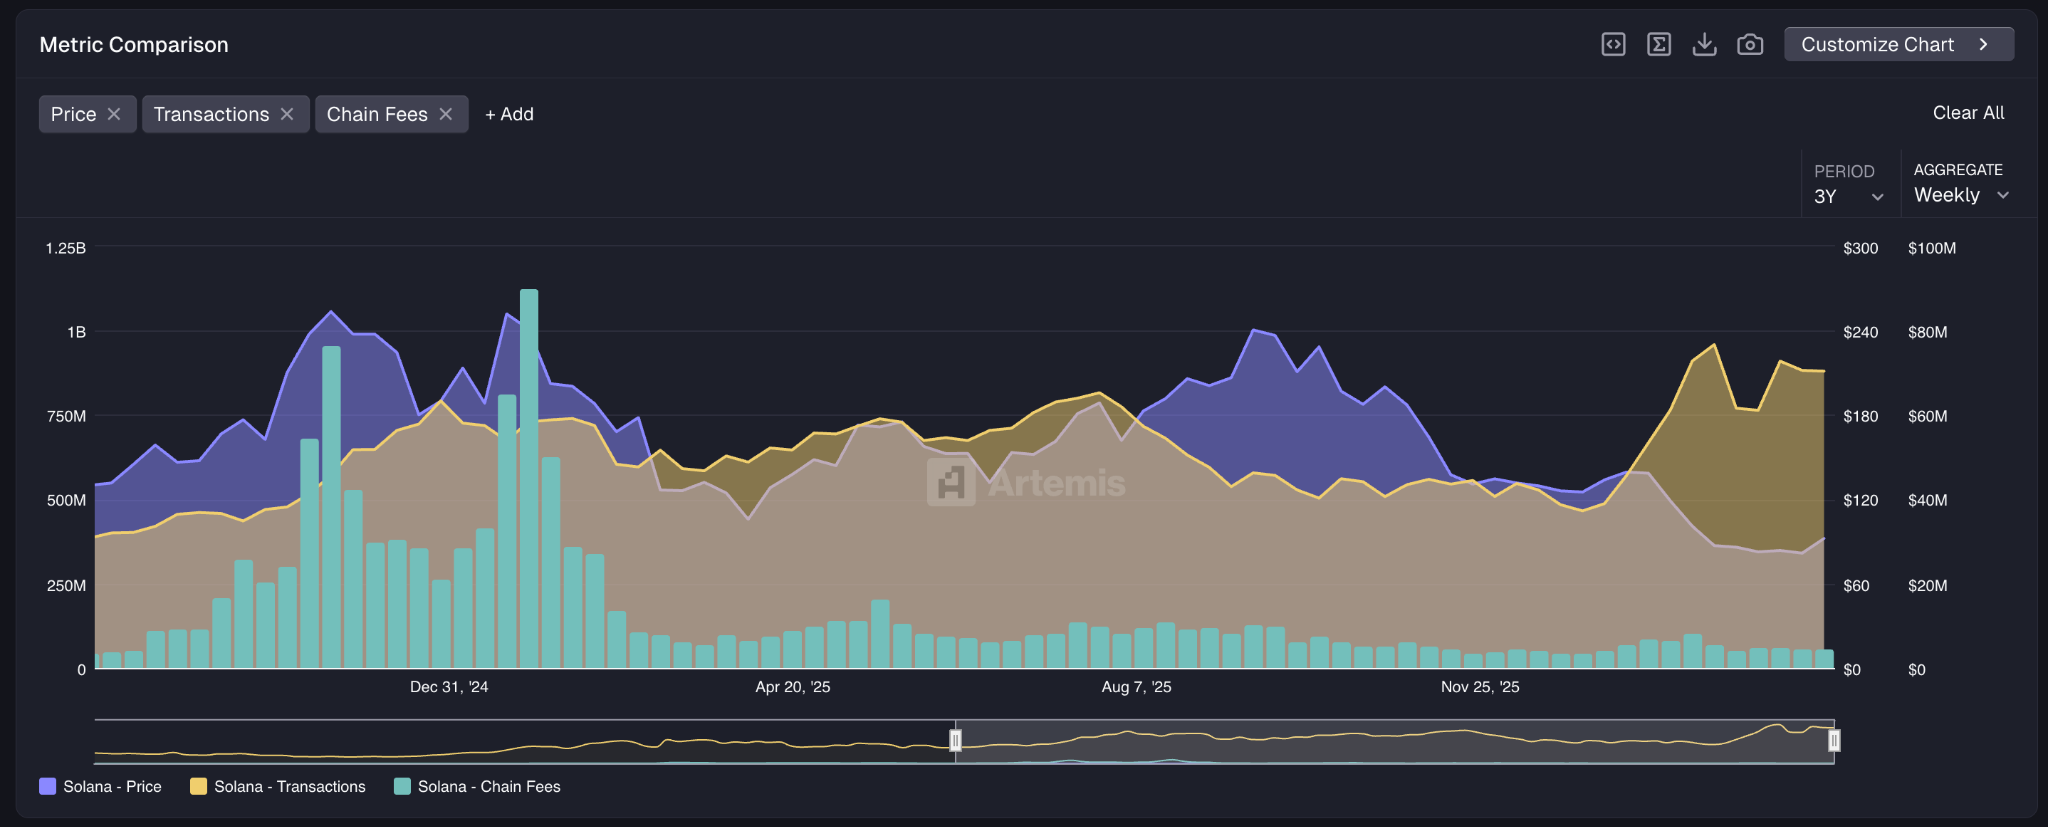
Despite impressive transaction throughput, weekly fee collection totaled merely $4.6 million. This represents a 50% reduction compared to fees generated during Solana’s June–September 2025 price surge, when transaction volumes were comparatively lower at 700–800 million weekly.
Reduced fee generation typically suggests diminished network valuation. Market analysts interpret the existing disparity between transaction activity and fee income as a potentially bearish indicator for the intermediate timeframe.
From a technical perspective, SOL confronts significant resistance at the $87 threshold. A decisive break beneath this level could trigger downward momentum toward $77, representing an 11.5% potential decline. Conversely, if support holds and substantial volume emerges during U.S. market hours, this could facilitate a recovery toward the $100 milestone.
Real-World Asset Platform Surpasses $1.82 Billion
Solana’s tokenized real-world asset infrastructure exceeded $1.82 billion in aggregate value on March 20. This encompasses tokenized bonds, stocks, and investment vehicles migrated onto blockchain technology.
DeFi protocols backed by real-world assets operating on Solana achieved a record $465 million in total value locked. Although Ethereum maintains dominance in overall RWA market capitalization, Solana continues expanding its footprint within this emerging sector.
Digital asset analyst Crypto Patel shared insights on X highlighting that monthly chart patterns reveal a validated breakout, successful support retest, and maintained price floors. The analyst emphasized properly established Fibonacci retracement zones and characterized the $50–$80 band as an exceptional accumulation opportunity. Drawing from historical cycle analysis, Patel outlined potential price targets between $500–$1,000 if previous market patterns materialize.
SOL currently fluctuates around $88, with the $87 threshold serving as the immediate critical support zone for short-term price direction.