
 Stock Plummets to $2,100 as MVRV Metric Signals Potential Bottom")
Key Takeaways
- The MVRV ratio for Ethereum has declined into the 0.8–1.0 range, a zone that historically precedes significant market recoveries
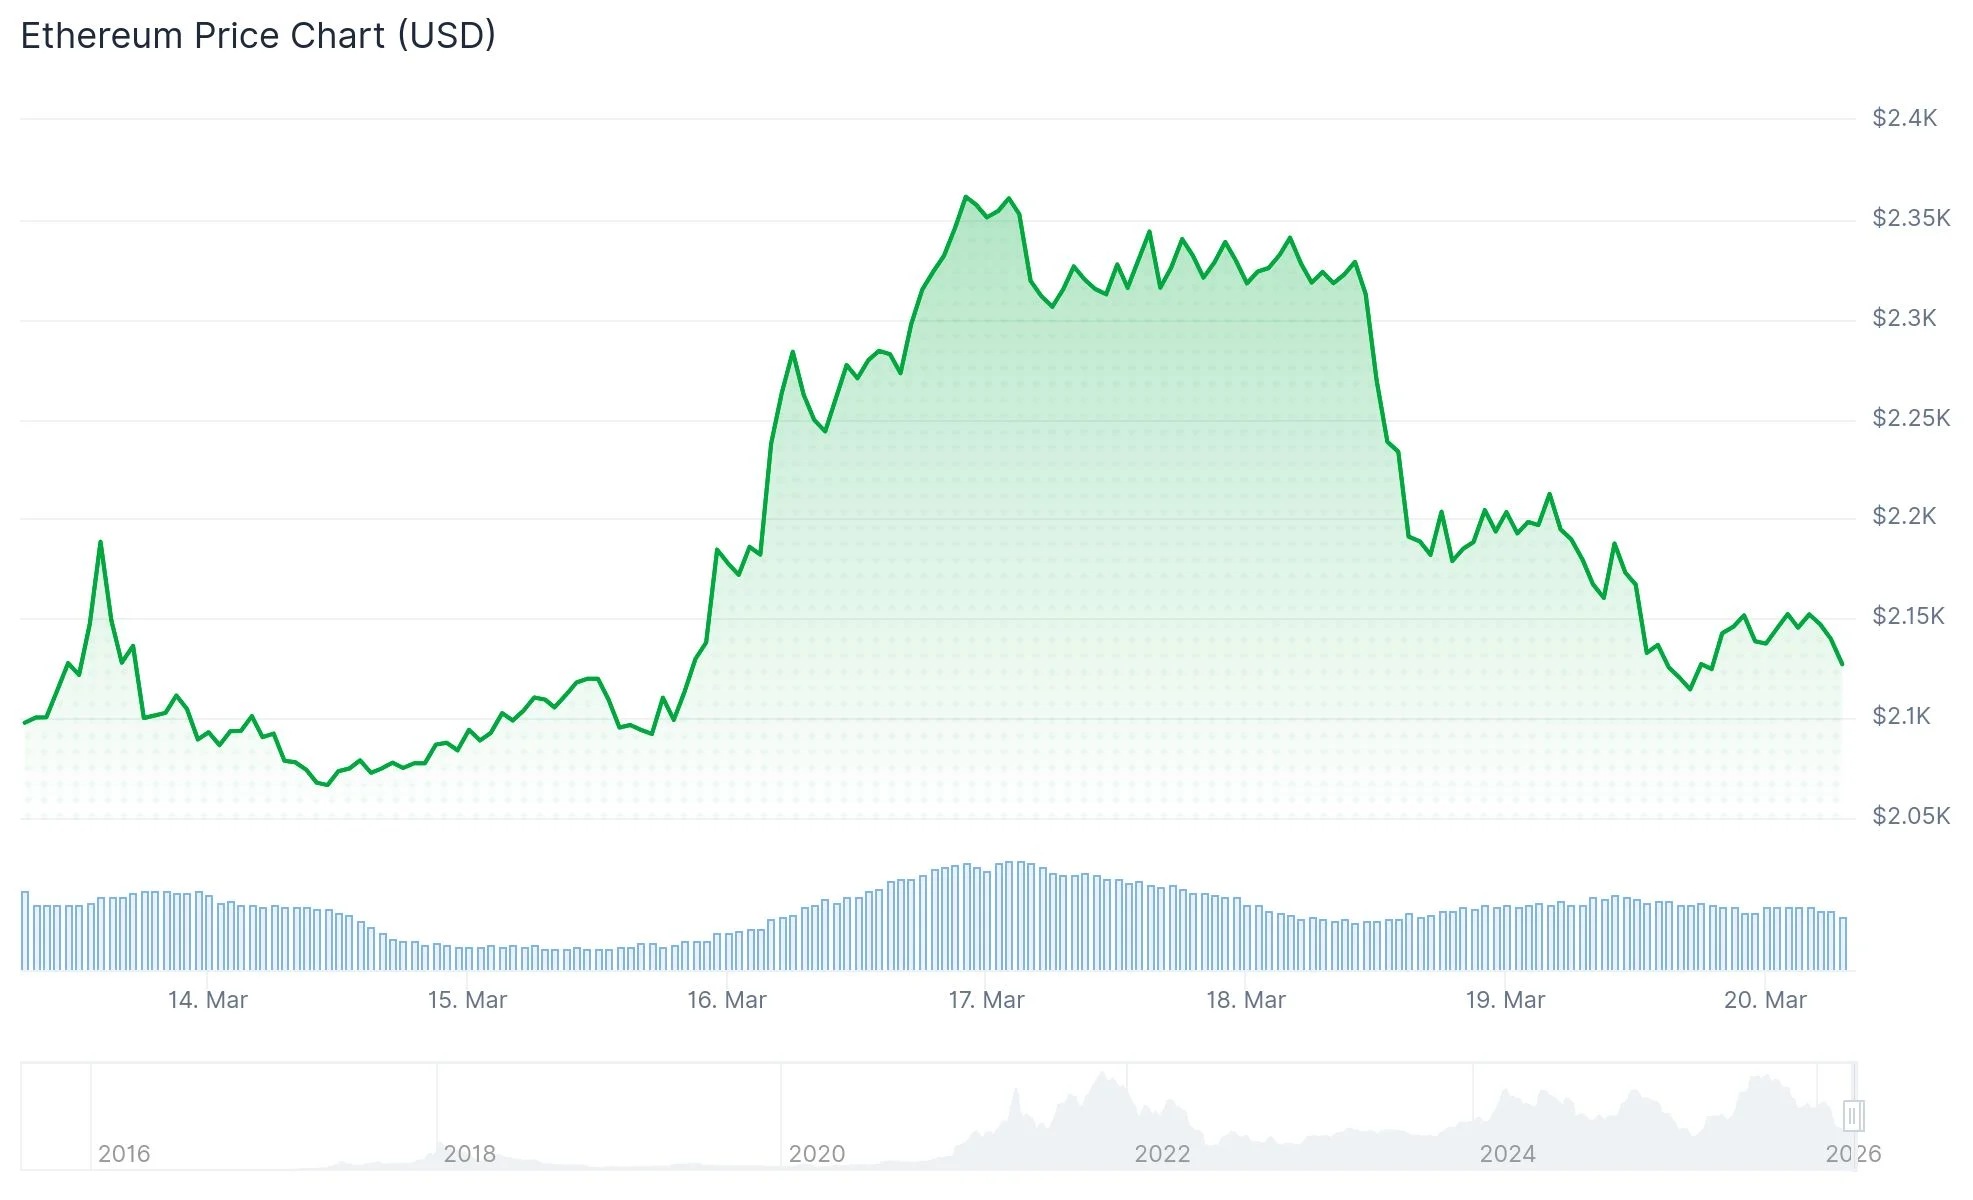
- Following a rejection at $2,400, ETH has declined to support near $2,100
- Current trading activity places ETH beneath the $2,200 mark and its 100-hourly Simple Moving Average
- Immediate support levels are concentrated between $2,100 and $2,150, with additional backing around $1,770 should these levels fail
- Breaking above $2,200 could trigger upward momentum toward $2,240, $2,275, and possibly $2,385
Ethereum has settled near $2,100 following a significant pullback from the $2,385 zone. The cryptocurrency breached multiple support levels including $2,320 and $2,250, ultimately breaking through a key uptrend line that had provided stability around $2,160 on the hourly timeframe.
The recent low touched $2,100, with current price action consolidating marginally above this threshold. ETH is positioned beneath the 23.6% Fibonacci retracement level calculated from the $2,385 high to the $2,100 low.
Additionally, the asset trades underneath its 100-hourly Simple Moving Average, reinforcing the near-term bearish momentum.
Immediate resistance emerges at $2,165, with a more substantial barrier at $2,200 aligning with the 100-hourly SMA. Reclaiming the $2,200 level represents a critical milestone for any potential reversal.

Should ETH successfully breach $2,200, subsequent targets include $2,240 (corresponding to the 50% Fibonacci retracement), followed by $2,275 and $2,320. Extended strength could propel the price toward $2,385.
Conversely, failure to hold $2,100 would expose lower support zones at $2,060 and $2,020. The psychological $2,000 threshold is widely regarded as a major support foundation.
Historical MVRV Zone Suggests Accumulation Opportunity
From a broader perspective, Ethereum’s MVRV ratio has descended into the 0.8–1.0 territory. Analyst Ali Charts, referencing Glassnode metrics, highlights that this range has historically preceded substantial multi-month rallies.
https://twitter.com/alicharts/status/2034559606668570900?s=20
Previous recoveries originating from this zone have delivered gains spanning approximately 129% to exceeding 5,000%, though each occurrence unfolded within distinct market environments. While this metric doesn’t guarantee immediate price appreciation, it suggests that downside risk may be considerably reduced compared to levels observed near previous peaks.
ETH achieved a cycle peak around $4,955 prior to the current correction. The present valuation near $2,100 reflects a decline exceeding 57% from that summit.
Technical Analyst Highlights $2,150 as Crucial Support
Market analyst Ted Pillows shared insights on X regarding Ethereum’s technical positioning. He observed that ETH experienced a decisive rejection at the $2,400 resistance zone and is presently testing $2,150 as potential support.
https://twitter.com/TedPillows/status/2034554720593772615?s=20
The technical analysis presented by Ted Pillows illustrates a pattern of descending highs, with successive rebounds unable to generate substantial upward momentum. This formation suggests continued downside risk if critical support fails.
The $2,150 area corresponds with a previous consolidation region and serves as a pivotal short-term reference point for traders.