
 Stock: Is History About to Repeat at This Critical Support Zone?")
Key Highlights
- ADA currently trades within the $0.18–$0.25 range, a support level that has proven resilient across several market cycles.
- Daily chart analysis reveals compressing Bollinger Bands, typically a precursor to significant volatility.
- LayerZero integration now links Cardano to more than 160 blockchain networks and approximately $90 billion in cross-chain liquidity.
- Technical analysts are monitoring critical resistance levels at $1, $3, and $10.
- A decisive move above the long-term descending trendline established at the 2021 peak would signal a potential trend reversal.
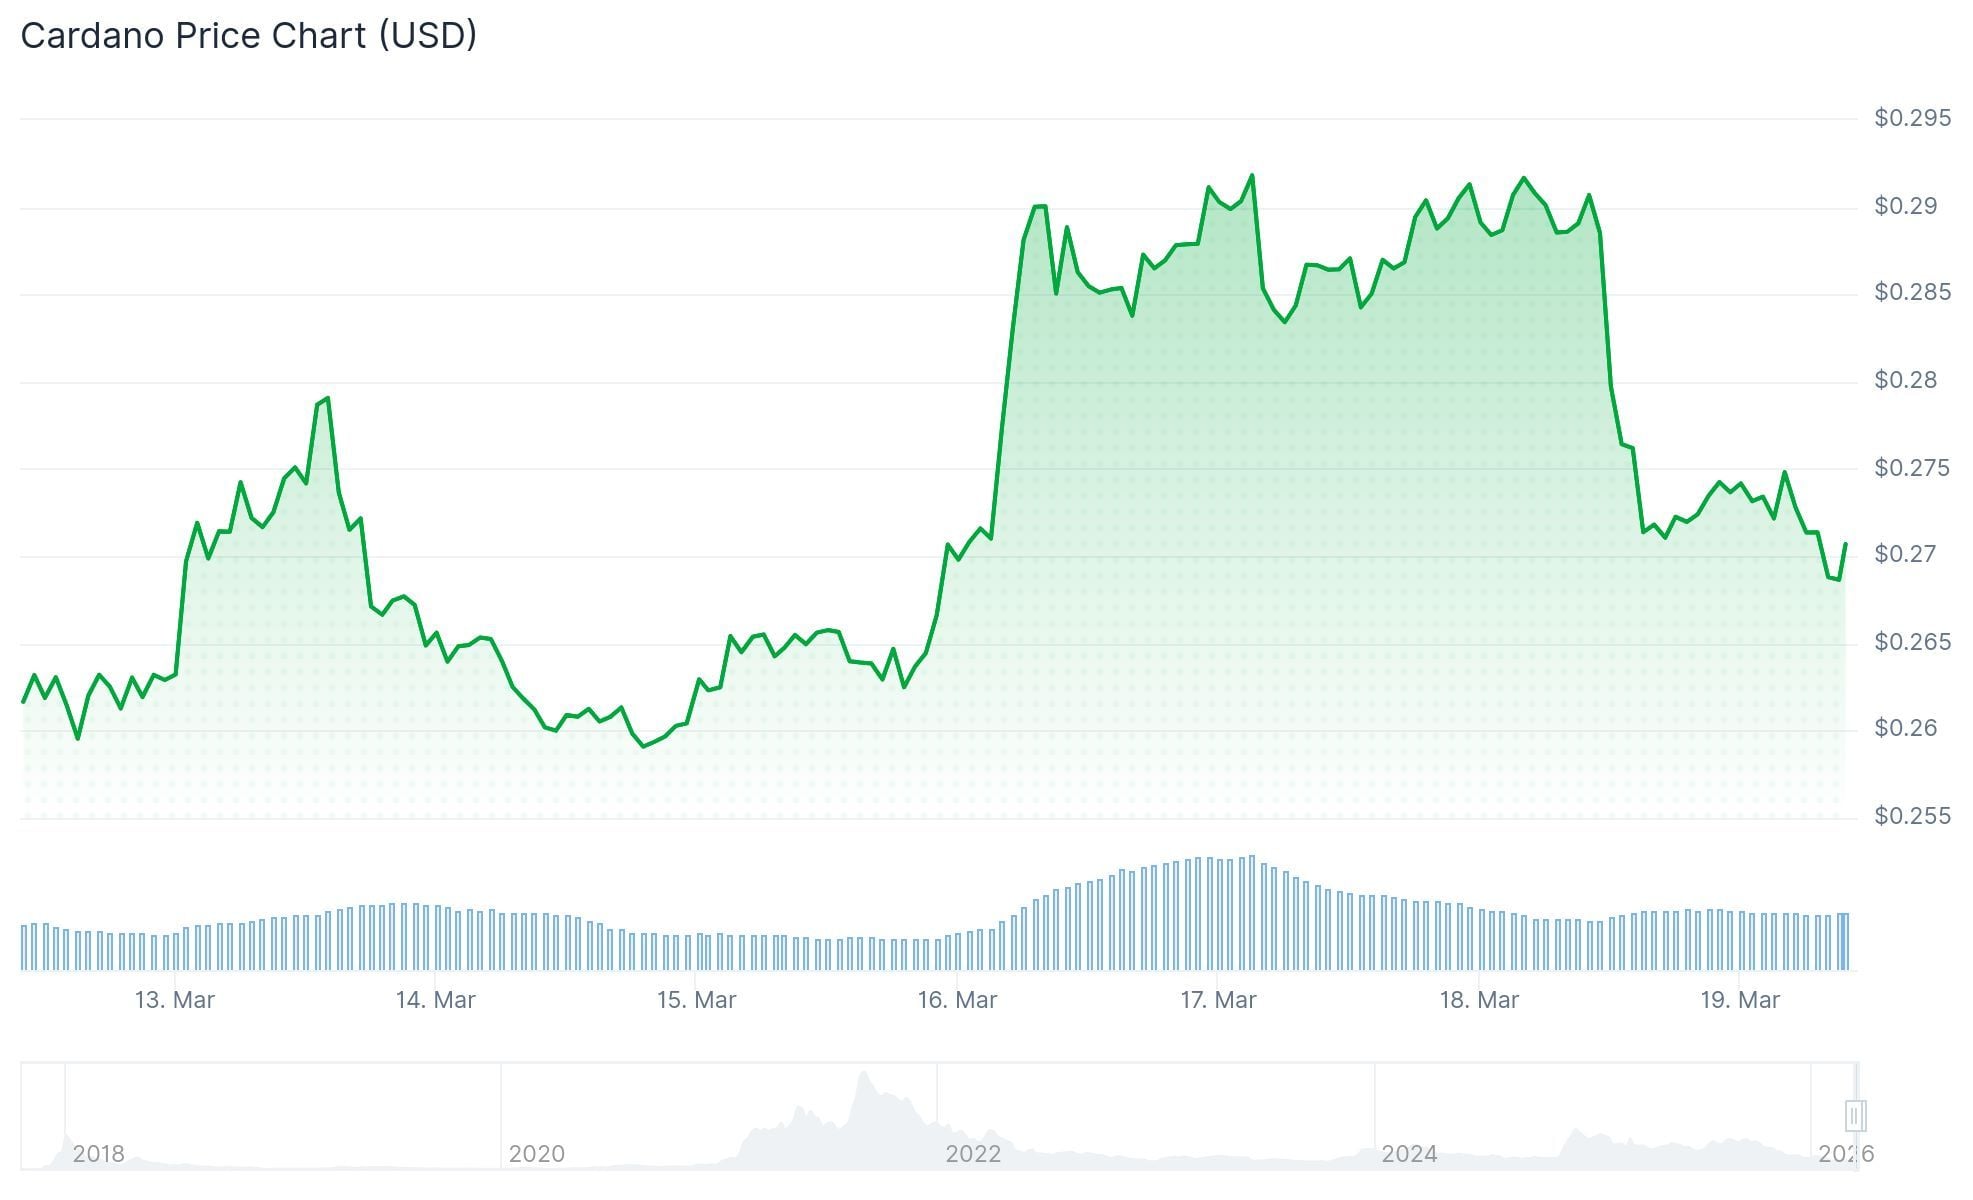
Cardano (ADA) currently changes hands near $0.27, positioned within a significant long-term support area that has historically preceded notable price rebounds. The digital asset remains approximately 79% below its record high of $3.10 achieved during the 2021 bull market.
The $0.18 to $0.25 support corridor has emerged as a critical price floor throughout multiple market cycles. During June 2023, ADA descended to $0.22 within this zone before staging a remarkable recovery to $1.32 by December 2024.
More recently, in February 2026, the cryptocurrency touched $0.2205 before finding buying support once again within this established range. Following this test, the price has stabilized slightly above the zone, entering a consolidation phase.
Market analyst Crypto Patel has emphasized that Cardano currently occupies this multi-year accumulation territory. His analysis suggests that the consistent defense of this price level indicates potential accumulation by long-term investors.

Chart Analysis and Technical Indicators
Technical indicators on the daily timeframe show Bollinger Bands narrowing considerably, a pattern commonly observed before substantial directional moves. ADA’s current price hovers around its 20-day moving average, indicating neutral short-term momentum.
The MACD indicator displays a tentative bullish crossover, though overall momentum remains subdued. Both signal lines continue trading beneath the zero threshold, suggesting that buying pressure has not yet established dominance.
A downward-sloping resistance trendline has remained intact since the 2021 peak, repeatedly rejecting upward price attempts throughout recent years. The cryptocurrency now finds itself squeezed between this overhead resistance and the robust support zone underneath.
In mid-March 2026, ADA experienced a single-day decline of 5.56% amid selling activity, yet successfully maintained support above the $0.247 level.
LayerZero Network Connection
Cardano finalized its LayerZero integration during March 2026. This technological advancement establishes connectivity with over 160 blockchain networks and provides access to approximately $90 billion in cross-chain digital assets.
This integration eliminates reliance on conventional bridge protocols or centralized intermediaries for transferring liquidity or data across different blockchain ecosystems. Market commentator Midtern characterized this development as potentially catalyzing increased DeFi participation and attracting developer attention to the Cardano ecosystem.
Should the support zone maintain its strength and ADA successfully breaches the descending resistance barrier, market analysts have identified several price objectives. The initial target sits at $1, representing approximately a 270% gain from present valuations.
Progressing further, the $3 level corresponds with the 2021 all-time high and would constitute roughly a 1,000% appreciation. Some analysts have also referenced $5 as a potential target, reflecting an approximately 1,750% advance under extended bullish scenarios.
Crypto Patel additionally noted that certain market observers have suggested $10 as a conceivable level during a comprehensive altcoin bull cycle, though this target remains substantially above current technical structure.
As of mid-March 2026, ADA continues trading marginally above the $0.247 support threshold, with the Bollinger Band compression pattern still developing.