
 Stock: Falling Wedge Formation Captures Market Attention")
Key Takeaways
- A falling wedge configuration is developing on DOGE’s daily timeframe, a pattern that often signals significant price movements ahead.
- Critical resistance lies between $0.105 and $0.11, corresponding with important Fibonacci retracement zones.
- The Relative Strength Index has climbed out of oversold conditions and is nearing neutral territory with modest bullish momentum.
- The 50-day exponential moving average presents a substantial obstacle above current price levels, and breaking above it would mark an initial indication of trend reversal.
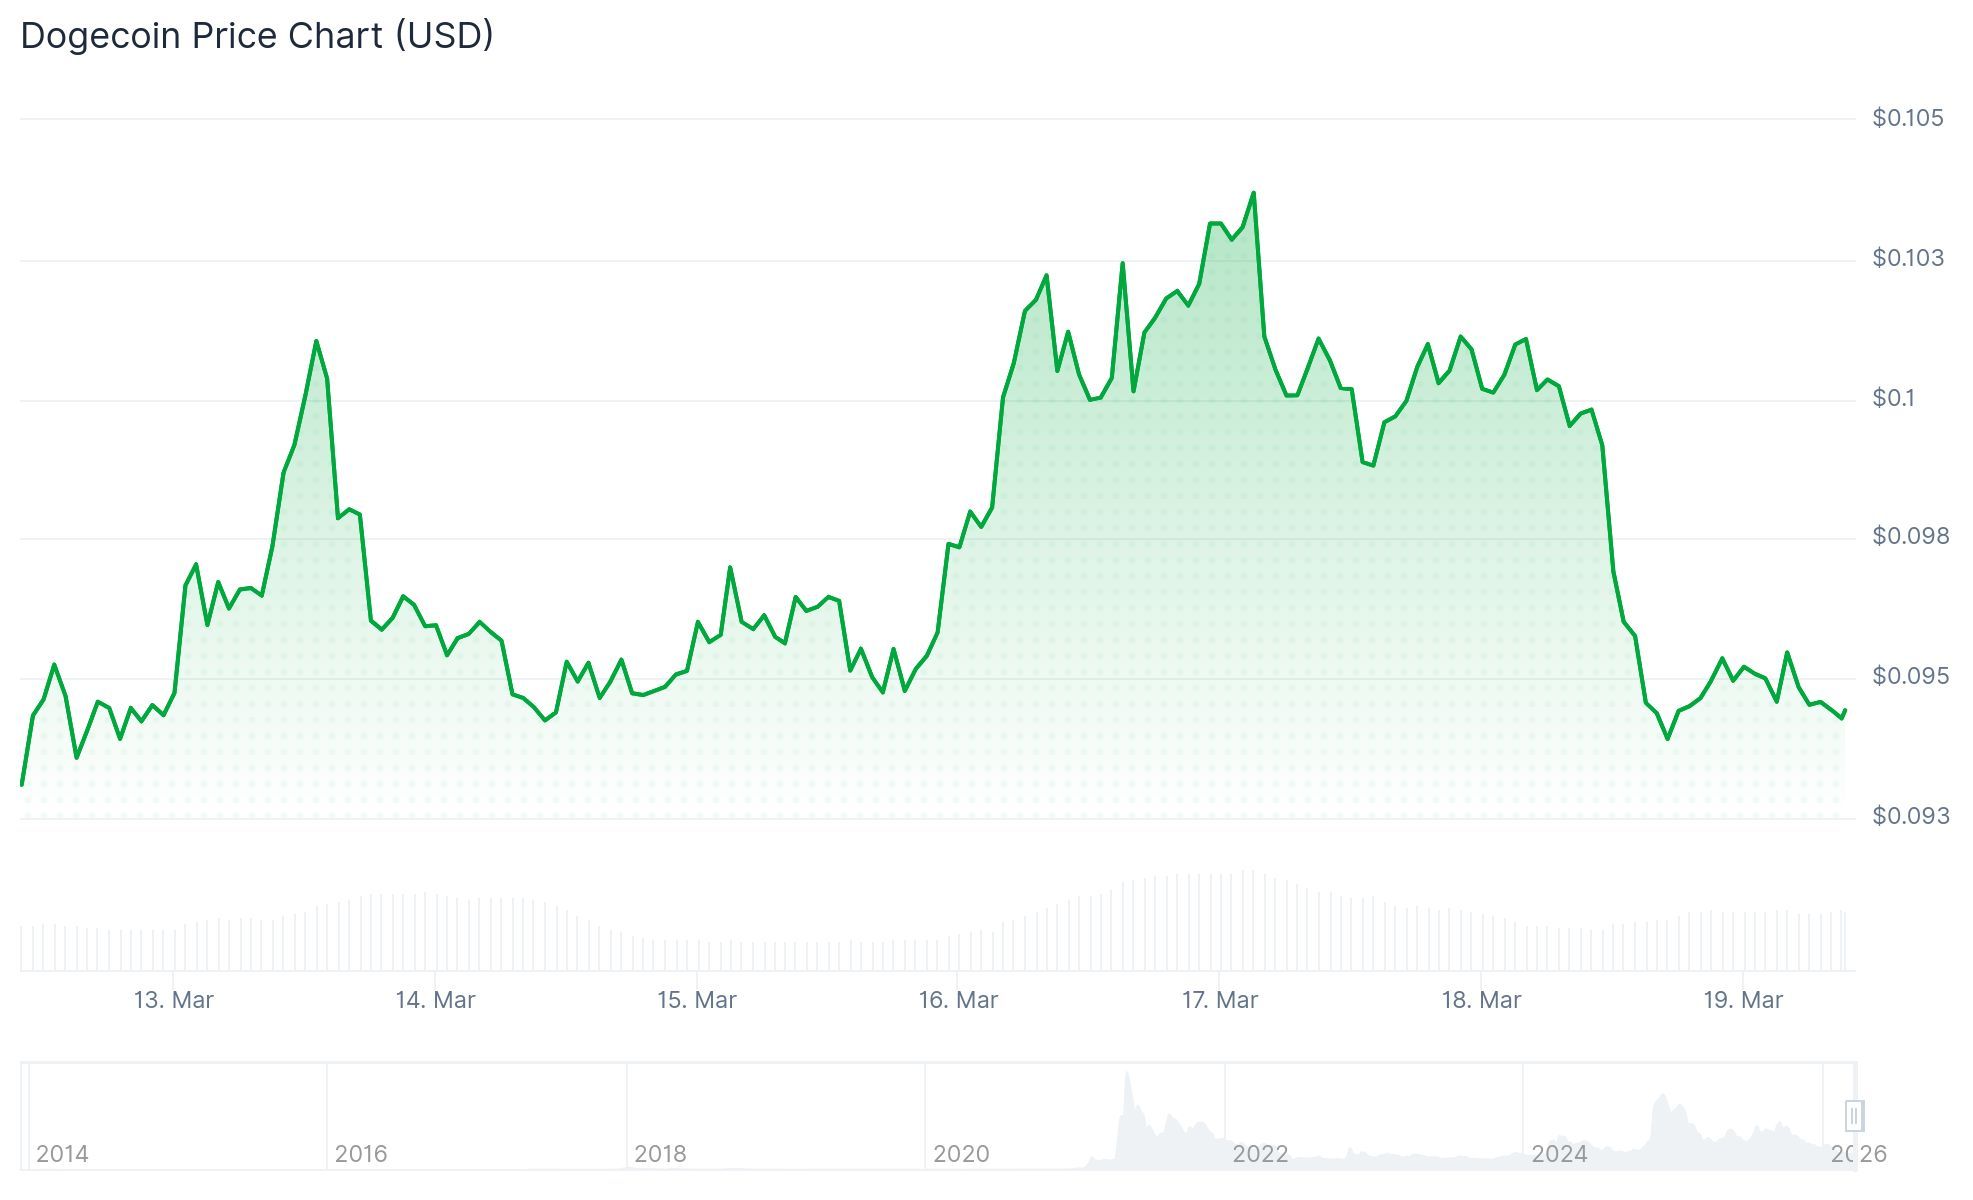
- On March 18, DOGE changed hands around $0.094, registering a decline of approximately 5% over the previous 24-hour period.
Dogecoin continues to consolidate around the $0.10 threshold, forming a tightening pattern that has caught the eye of technical analysts. This particular formation has garnered interest due to historical precedents suggesting what might unfold—though immediate price action remains uncertain.
Analyzing the daily timeframe reveals DOGE developing what technical chartists identify as a falling wedge structure. This configuration emerges when an asset records descending peaks while the troughs progressively narrow. As this price channel tightens, a breakout typically materializes. Market participants who maintained positions through the decline anticipate this breakout will trend upward.
This compression phase initiated following a corrective wave that came after robust earlier rallies. Throughout this period, Dogecoin has registered diminishing highs alongside weakening downward momentum, indicating that selling pressure may be exhausting itself.
Near-Term Price Barriers Remain Intact
The initial obstacle facing any potential rally centers on the $0.105 to $0.11 region. This zone aligns with the 0.5 through 0.618 Fibonacci retracement measurements derived from the latest downward swing. Additionally, it coincides with a cluster of short-duration exponential moving averages, creating a concentrated resistance barrier.

Dogecoin has challenged the $0.10 mark on numerous occasions throughout the preceding twelve months. During each instance when price managed to breach this level, selling interest reemerged and drove it lower. Market observers note this recurring behavior has diminished $0.10’s effectiveness as a dependable floor.
A decisive breakthrough beyond $0.11 would establish a pathway toward $0.116, with $0.136 representing the subsequent target. In the absence of such a move, price action continues to operate beneath the 50-, 100-, and 200-day moving averages, maintaining the prevailing downtrend.
As of March 18, DOGE was quoted near $0.094, reflecting a 4.84% intraday decline.
The 50-Day Moving Average Represents the Critical Hurdle
Should DOGE manage to overcome $0.11, the 50-day exponential moving average looms directly overhead and has shadowed the downtrend since the correction commenced. This particular moving average continuously adjusts with price movement, complicating efforts to establish a durable breakout above it.
Traditionally, successfully recapturing the 50 EMA has served as the initial reliable indication that DOGE’s directional bias is transitioning. Absent this confirmation, technical analysts view any advance beyond $0.10 as merely a temporary rebound rather than a genuine trend reversal.
The RSI indicator has rebounded from oversold readings and currently resides near the centerline with subtle bullish characteristics. The MACD indicator similarly appears positioned for a potential bullish convergence, implying that downward pressure is moderating.
Current market data confirms DOGE maintaining ground above its longer-duration support foundation at $0.086, representing the most recent localized bottom preceding the current rebound attempt.