
 Stock: Can $385M ETF Inflows Trigger a Major Price Rally?")
Key Takeaways
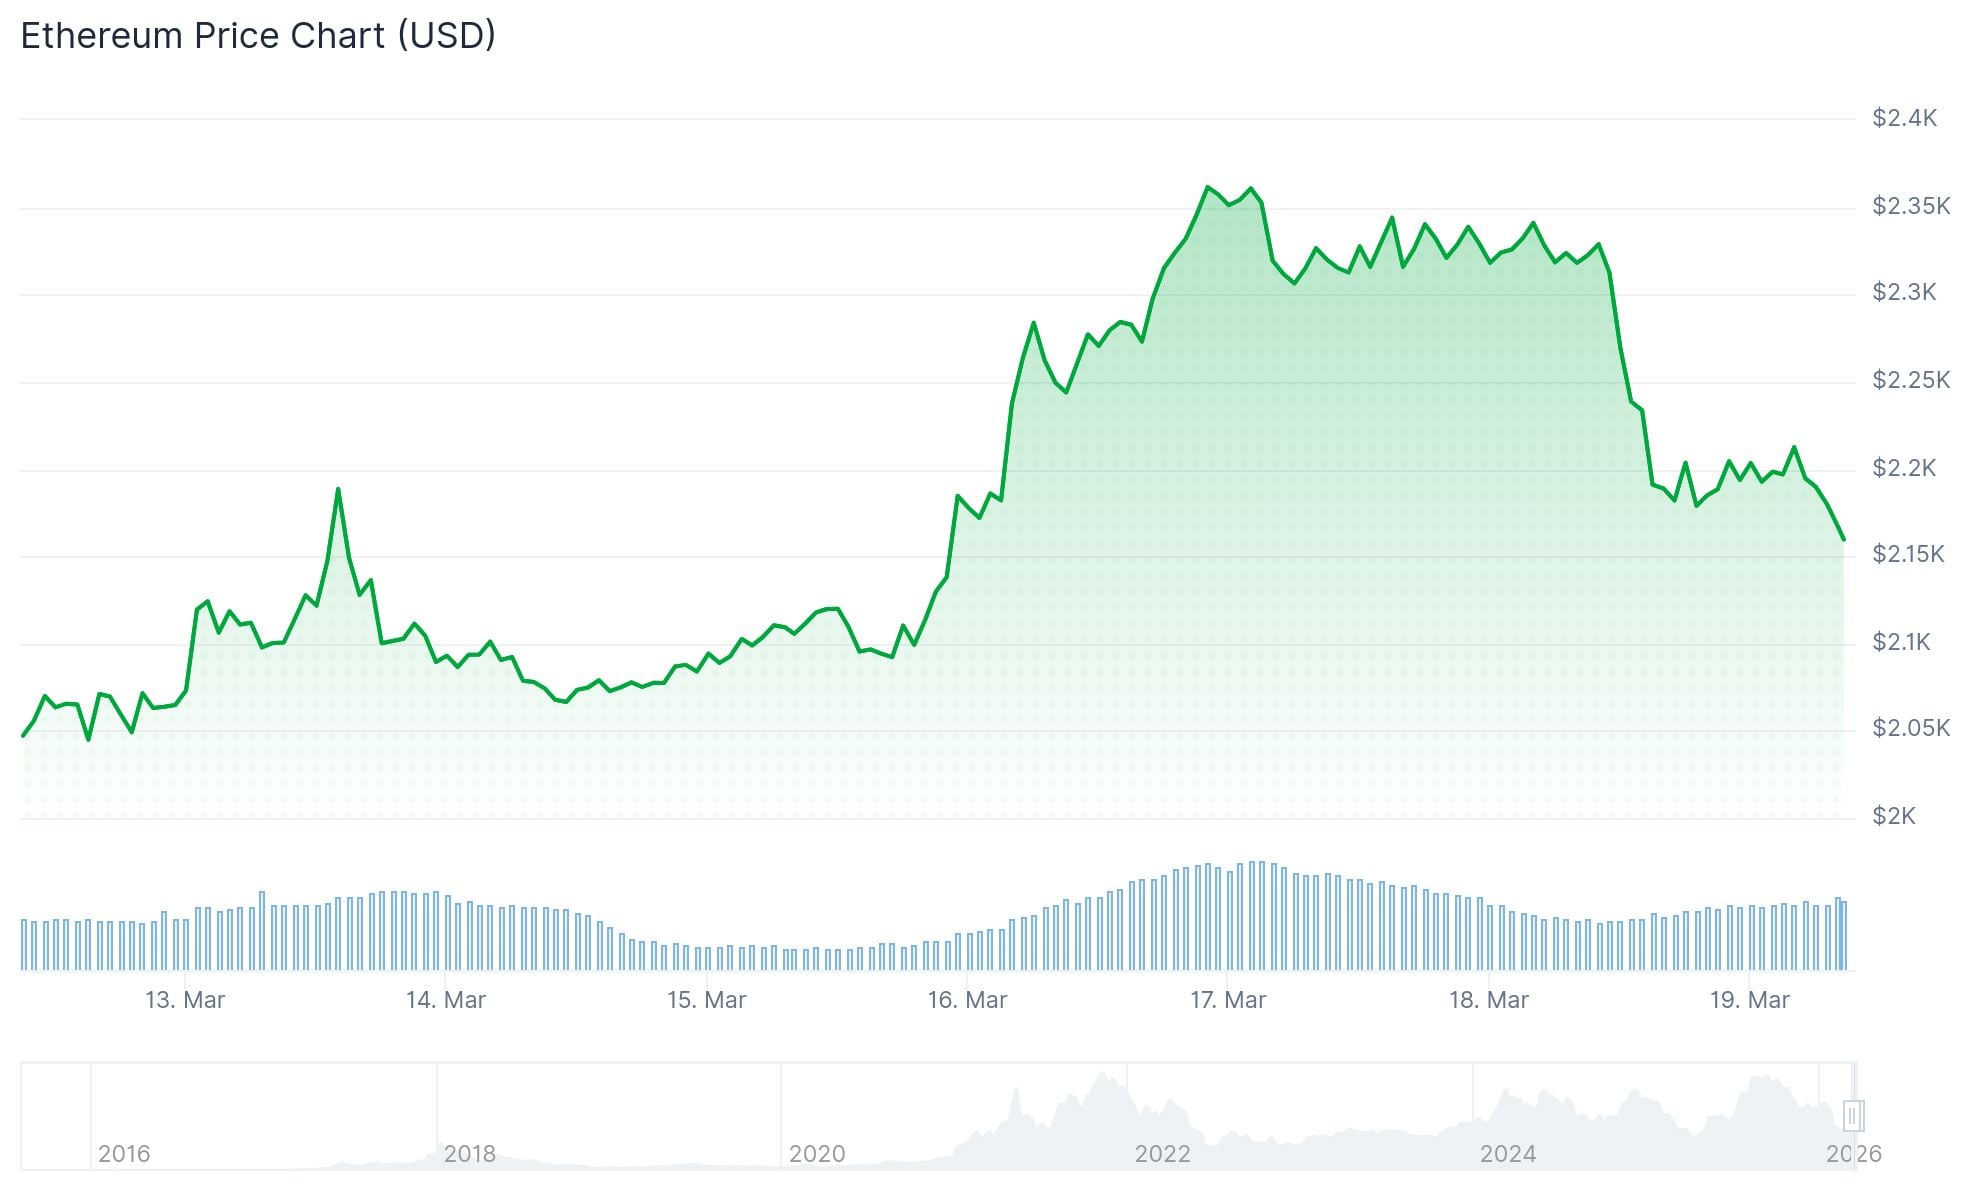
- Ethereum currently sits at $2,160.46, reflecting a 1.95% decline for the session
- The asset maintains position above its 50-day moving average at $2,100.87 while remaining significantly under the 200-day average of $3,204.32
- BlackRock introduced its staked ETH ETF (ETHB) this March, enhancing institutional participation options
- Spot Ethereum exchange-traded funds recorded approximately $385 million in net capital inflows during a six-day period in March
- Open interest in ETH derivatives surged by roughly 8–9% within 24 hours, crossing the $30 billion threshold
Ethereum is currently valued at $2,160.46, representing a $43.01 decline from yesterday’s close—a percentage drop of 1.95%. Trading commenced at $2,203.46 today, with price action contained within a range of $2,143.22 to $2,233.69.
This pullback arrives following several weeks of steady appreciation from the $2,000 threshold. Despite the current session’s retreat, ETH maintains gains of approximately 8–10% compared to early-month valuations. Trading volume registers at roughly 71 million dollars, substantially below the typical 343 million dollar average, suggesting routine consolidation rather than distressed liquidation.
Exchange-Traded Fund Activity and Professional Investment Trends
Among the most significant catalysts this month stands BlackRock’s introduction of the iShares Staked Ethereum Trust (ETHB) on the Nasdaq exchange. This product differentiates itself from previous spot ETH offerings by integrating staking rewards directly into the fund structure, creating enhanced appeal for professional capital seeking exposure to Ethereum’s yield-generating capabilities.
Spot Ethereum exchange-traded products have demonstrated consistent capital attraction. A recent trading session witnessed approximately 12.6 million dollars in net positive flows, with one individual fund accounting for over 10 million dollars of that total. Throughout a six-day window in March, these vehicles accumulated roughly 385 million dollars in aggregate inflows.

This institutional capital has provided crucial price stabilization during moments of speculative profit-taking.
Chart Analysis and Critical Price Zones
Examining the daily timeframe reveals ETH trading above its 50-day moving average, currently positioned at $2,100.87. This technical indicator has functioned as reliable support during recent price corrections.
The 200-day moving average remains considerably elevated at $3,204.32, indicating the broader trend has yet to achieve complete recovery.
Critical support zones are established at $2,000–$2,060. A breach below this area would expose the $1,800 level, which has historically marked the lower boundary of the prevailing range. Resistance concentration appears at $2,235–$2,380, while a decisive breakout would require clearing the $2,500 threshold.
Ethereum futures open interest experienced an approximate 8–9% expansion within a 24-hour timeframe, elevating total positioning above $30 billion across leading platforms including Binance, Bybit, and OKX. Derivatives market specialists observe that increasing open interest concurrent with price appreciation can amplify volatility in either direction.
ETH continues facing challenges establishing sustained trading activity above the $2,300–$2,400 corridor. The present market structure reflects consolidation characteristics, with compressed price candles and diminished realized volatility potentially preceding a significant directional breakout.
Ethereum’s total network valuation approximates $260.76 billion, securing its position as the second-largest digital asset by market capitalization.