
 Stock Resilience: BTC Dominates Gold and S&P 500 During U.S.-Iran Conflict")
Key Highlights
- BTC experienced an 8.5% decline at the onset of U.S.-Iran hostilities but has since recovered approximately 11% from its bottom.
- Every escalation in the conflict has prompted selling pressure, yet buyers consistently emerge at progressively higher price points.
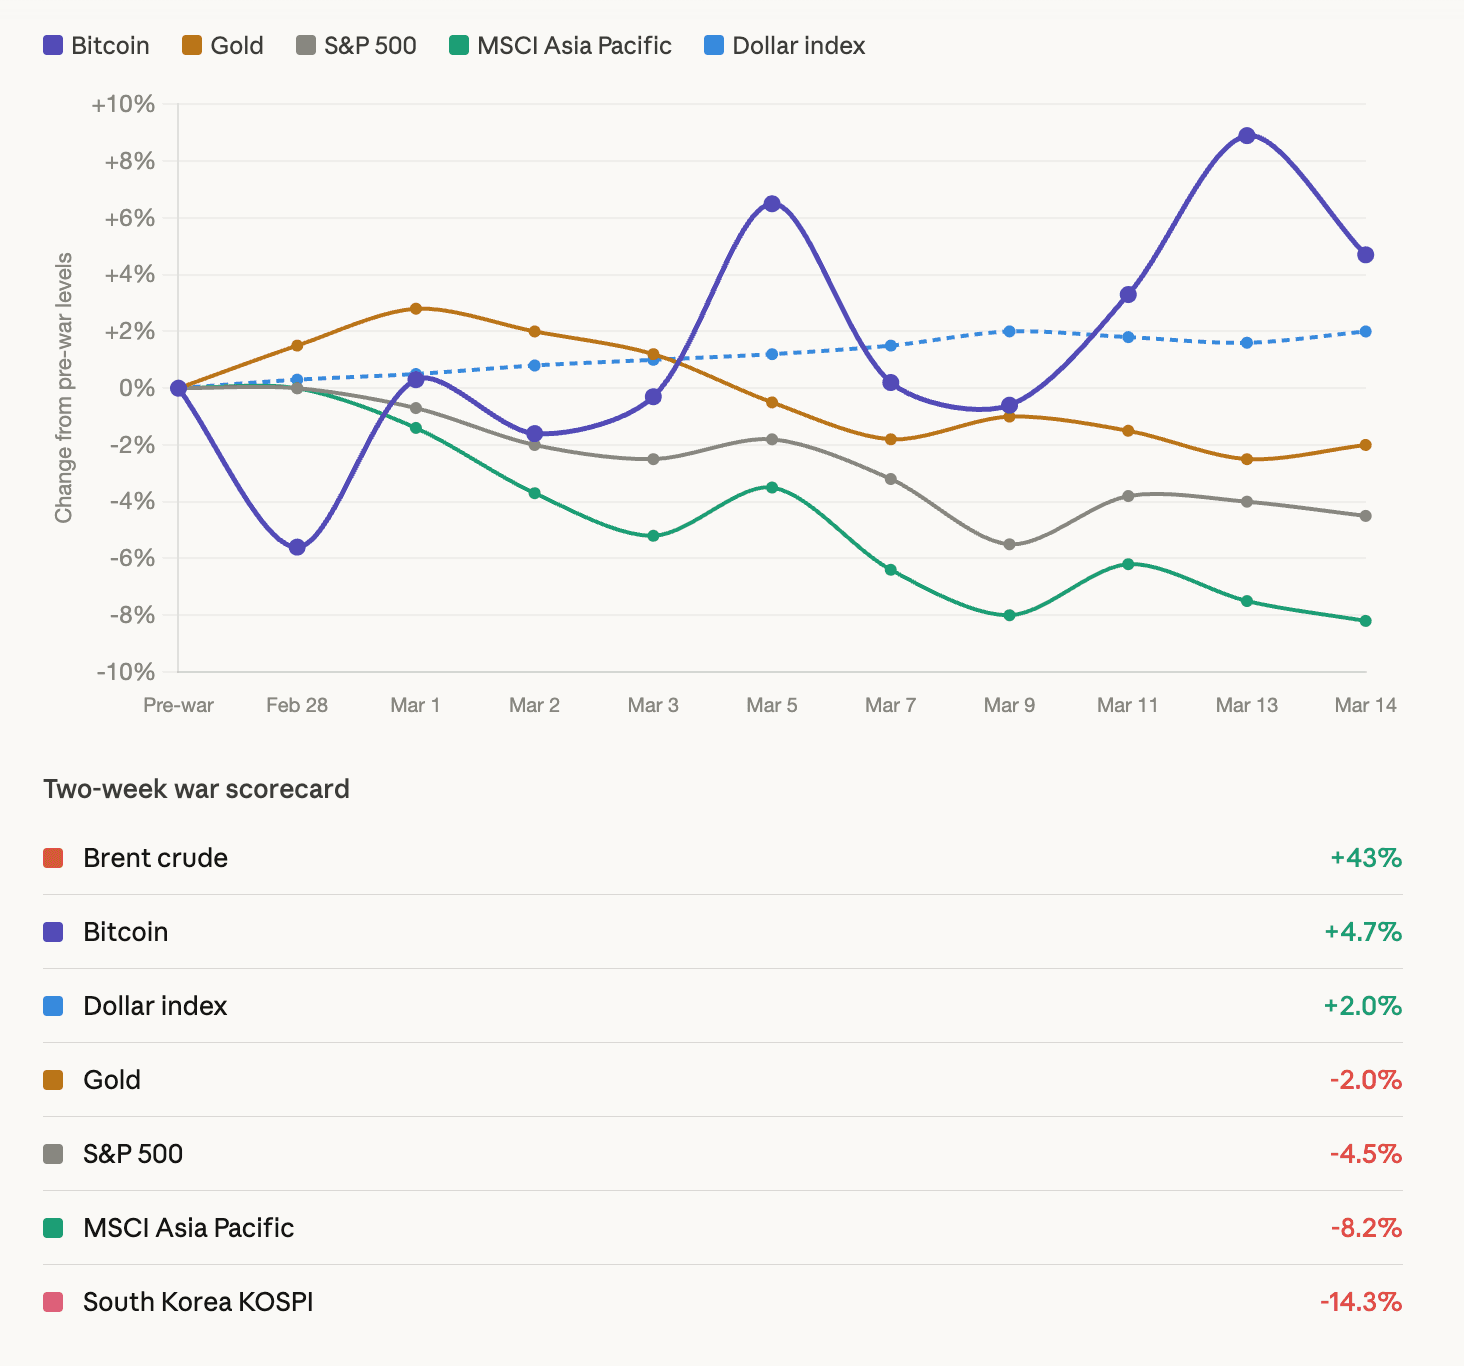
- Bitcoin’s performance has exceeded both gold and the S&P 500 during this two-week timeframe.
- Whale wallets are once again building positions around $71,000, with their holdings now representing 68.17% of circulating supply.
- Blockchain analytics indicate minimal selling pressure between present levels and approximately $82,000.
Bitcoin’s current market price stands at $71,500.
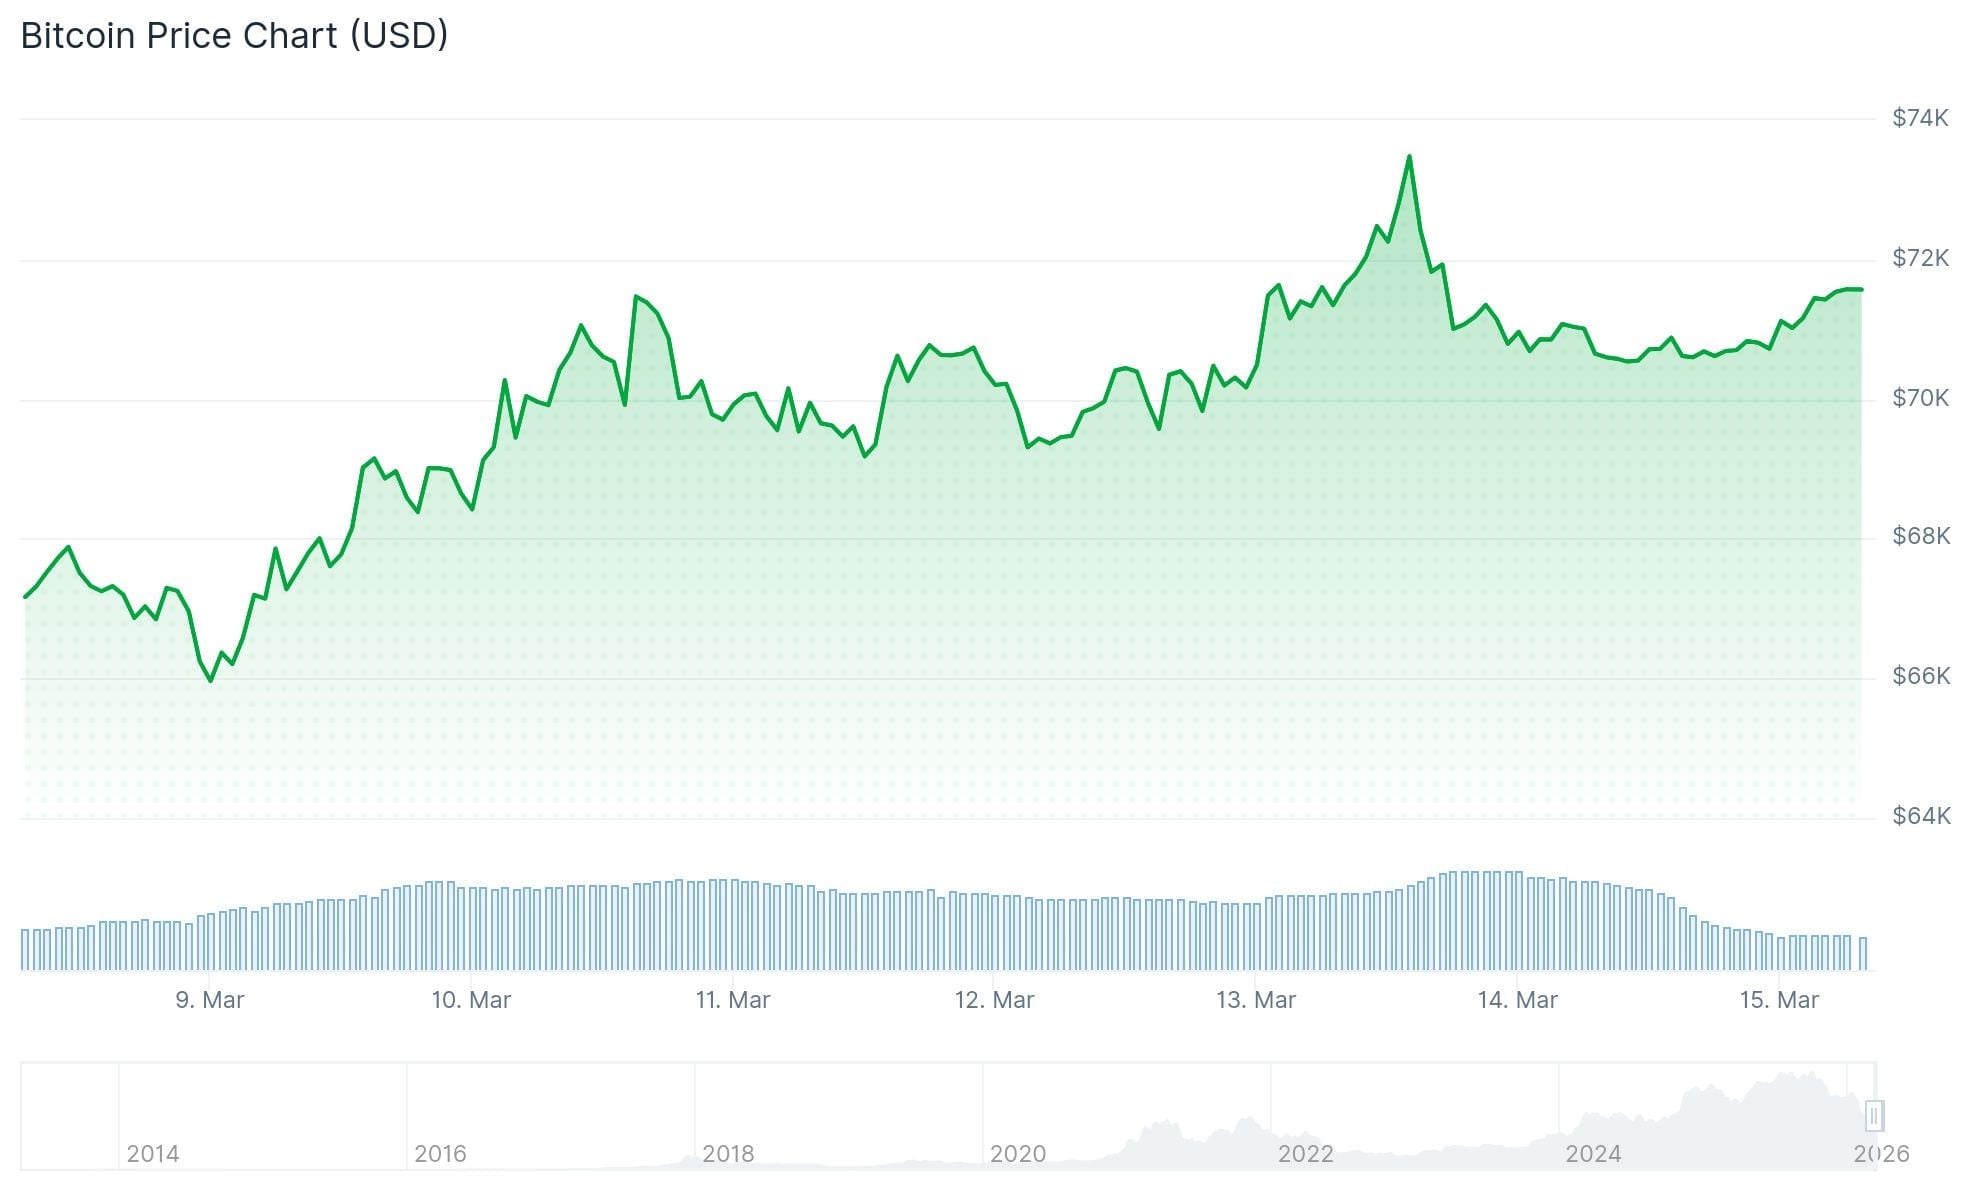
Hostilities between the U.S. and Iran commenced on Saturday, February 28. As the sole major financial market operating that day, Bitcoin experienced immediate impact with an 8.5% plunge to $64,000—marking its lowest valuation during this period.
Fast forward two weeks, and the landscape has transformed considerably.
From that nadir, Bitcoin has surged approximately 11%, currently changing hands near $71,500. During this identical timeframe, gold has experienced wild swings, the S&P 500 has declined, and Asian stock markets endured their most punishing week since 2020. Only crude oil—jumping over 40%—and the greenback have matched Bitcoin’s strength. Both assets derive direct advantage from the ongoing conflict.

Progressive Support Levels Following Each Downturn
Each intensification of tensions since February 28 has sparked Bitcoin selloffs. However, the critical difference lies in buyers consistently defending higher price territories.
Following Iran’s counterattack missile barrage on March 2, the cryptocurrency found support at $66,000. When conflict intensified through March 7, the floor elevated to $68,000. After maritime tanker incidents on March 12, BTC maintained $69,400. In the aftermath of the Kharg Island offensive on March 14, the low registered at $70,596.
This pattern reveals an ascending support trajectory of approximately $1,000–$2,000 following each geopolitical development.
Concurrently, Bitcoin has encountered resistance near the $73,000–$74,000 zone on four separate occasions. This overhead barrier remains intact. A resolution is imminent—either Bitcoin penetrates above $74,000, or a more severe escalation finally exhausts buying interest.
Earlier in the year, an abrupt liquidation cascade eliminated $2.5 billion worth of leveraged trades during one weekend, sending Bitcoin down to $77,000. That shakeout appears to have purged excessive leverage from the system, creating a more stable market structure capable of withstanding repeated conflict-related news without similar disruption.
Large Holders Buying Again, Blockchain Metrics Signal $82K Possibility
Intelligence from blockchain analytics firm Santiment reveals that substantial Bitcoin holders—wallets containing between 10 and 10,000 BTC—have resumed accumulation near the $71,000 mark.
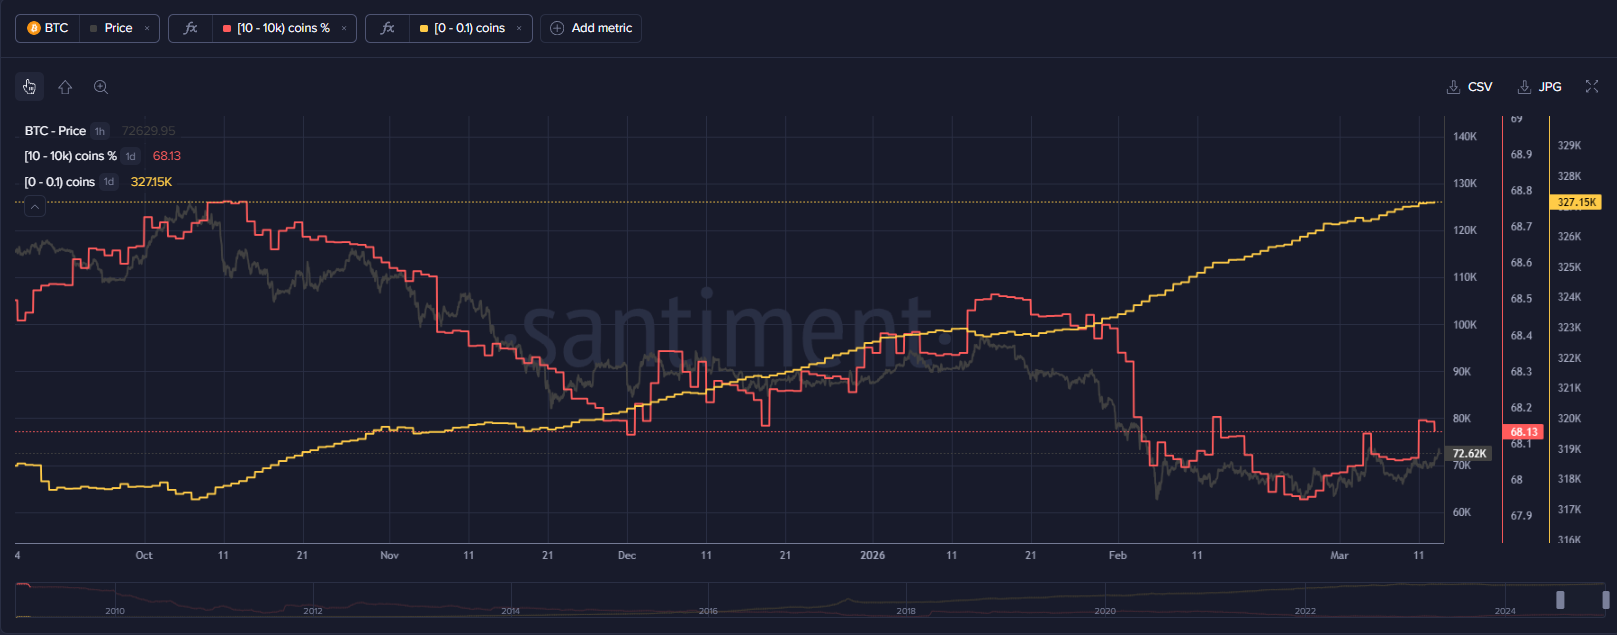
These addresses now command 68.17% of Bitcoin’s entire supply, climbing from 68.07% seven days prior. Santiment characterized this movement as a “positive reversal.” The analytics platform is monitoring whether retail participants begin distributing, which would traditionally indicate bottom formation.
The Crypto Fear & Greed Index registered 16 on Sunday—deep within “Extreme Fear” territory.
U.S. spot Bitcoin ETFs recorded their initial five-consecutive-day positive flow sequence of 2026 this week, attracting approximately $767 million.
Blockchain researcher Ali Martinez, referencing the UTXO Realized Price Distribution indicator, highlighted that Bitcoin presently encounters minimal overhead resistance between current valuations and approximately $82,045. The $74,000 rejection area, he observed, contains sparse investor cost-basis concentration, implying it may prove less formidable than surface analysis suggests.
The nearest substantial support beneath present prices exists around $66,898.
Bitcoin has appreciated 7.55% across the previous 30 days. BTC presently trades at $71,500.