
 Stock: Exchange Deposits Spike 800% — Could $65 Be Next?")
Key Takeaways
- Year-to-date losses exceed 30%, with consecutive rallies producing progressively lower peaks
- Funding rates remain in negative territory for 21 consecutive weeks, echoing a 2022 trend that preceded a significant uptrend
- Open interest has plummeted from $7.58 billion down to $1.9 billion, reducing potential for short squeeze scenarios
- Daily exchange deposits have skyrocketed 800% from February levels, jumping from 245,691 SOL to beyond 2.2 million SOL
- Critical price floors are positioned at $82 and $75, while a breach could drive prices toward $65
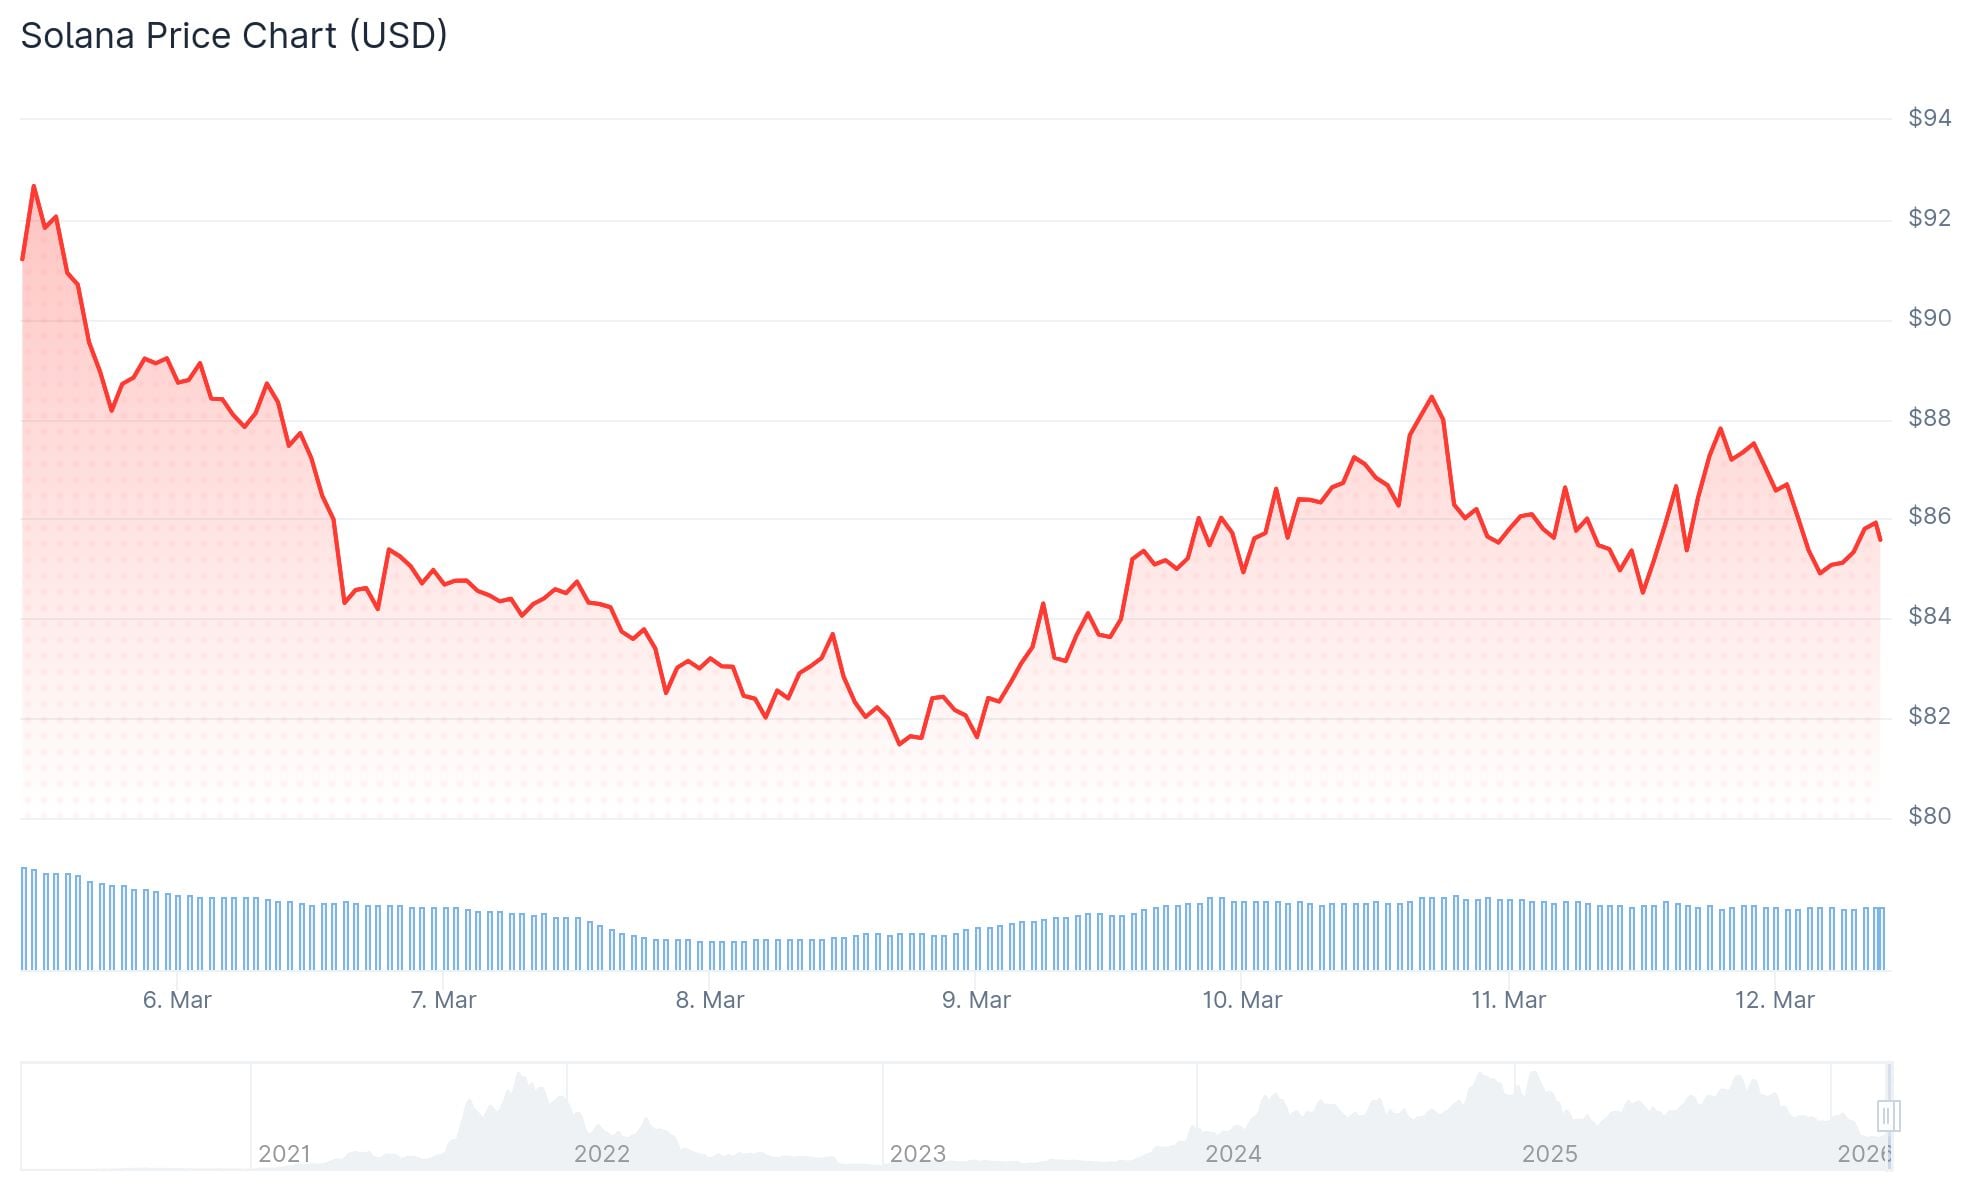
While Solana’s monthly performance shows only a modest 1.4% decline over the last 30 days, the broader trend paints a more concerning picture. Since the start of 2026, SOL has shed over 30% of its value, with every upward movement stalling at progressively weaker resistance levels.
Beneath the surface of this recent sideways action, mounting bearish pressure is becoming increasingly evident.
A critical futures market indicator — the funding rate — has remained in negative territory for a remarkable 21 consecutive weeks. When funding rates turn negative, it indicates that traders holding short positions are compensating those holding long positions. This dynamic reveals a market dominated by bearish sentiment.
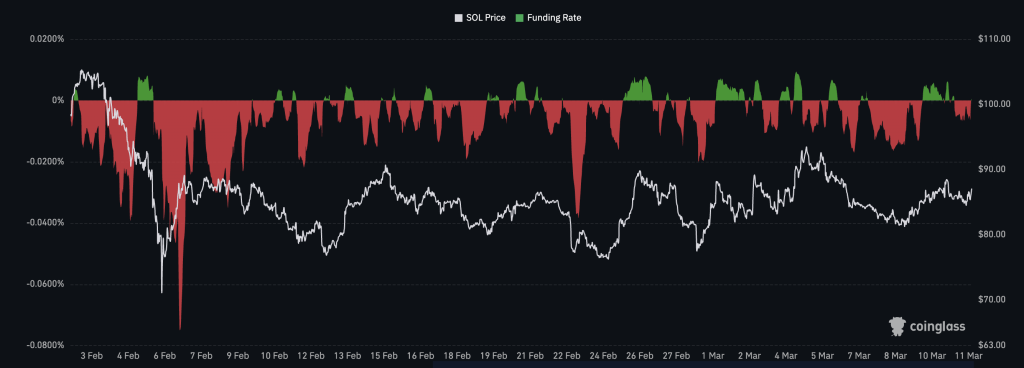
Historically, a similar pattern emerged during a 53-week period spanning February 2022 through February 2023. Throughout that extended timeframe, SOL plummeted to a cycle bottom of just $7. However, as that negative streak concluded, prices began a gradual recovery — ultimately surging to $209 by March 2024.

The current 21-week negative funding pattern shares structural similarities with that earlier period. However, one crucial factor distinguishes the two scenarios.
Derivatives Market Interest Collapses
SOL’s open interest in futures markets reached its zenith at $7.58 billion in September 2025. Currently, it hovers around $1.9 billion — marking the lowest level observed since early March 2025. This represents an approximately 75% decline.
Reduced open interest indicates insufficient leveraged short positions to catalyze a substantial short squeeze. In the absence of this potential catalyst, price rebounds typically lack staying power.
From a technical perspective, SOL has been confined within an ascending channel formation since early February. While this might appear constructive, the channel developed immediately following a steep decline from $148 to $68. Technical analysts interpret this as a continuation structure — not a trend reversal.

On-Chain Metrics Signal Distribution
Blockchain activity data reinforces the bearish narrative. Net Solana deposits to exchanges have registered positive values continuously since February 10. On that initial date, daily inflow volumes measured approximately 245,691 SOL. By March 10, that figure had exploded to 2,204,783 SOL — representing roughly an 800% surge within a single month.
Rising exchange inflows generally indicate that token holders are positioning assets for sale.
For a genuine market bottom to establish itself, analysts argue these inflows must reverse into persistent outflows. Such a shift has yet to materialize.
Immediate chart support zones are located at $82, followed by $79. Should these levels fail to hold, the projected channel target points toward $65.
On the bullish side, a daily closing price above $94 would disrupt the pattern of declining highs. A sustained move beyond $118 would be required to validate a complete trend reversal.
As of March 11, 2026, SOL is changing hands near $85, with exchange deposits continuing their upward trajectory and open interest remaining anchored near multi-month lows.