



Key Takeaways
- Ethereum sits at $1,794 with a 3.09% daily gain and $216.79B market capitalization
- Technical analyst Ted identifies $1,750 support as crucial for a potential climb to $1,850–$1,900
- Futures open interest climbed 3.63% to reach $24.65B, indicating increased market participation
- Ex-Bank of America strategist Stephen Suttmeier identifies formation of a “tactical bottom” above the $1,690 threshold
- Large holder distribution and $52M in ETF withdrawals present obstacles to the upward trajectory
Ethereum currently sits at the $1,794 price level and demonstrates indications of potential upward momentum, despite facing multiple resistance factors. Here’s what current market data reveals.
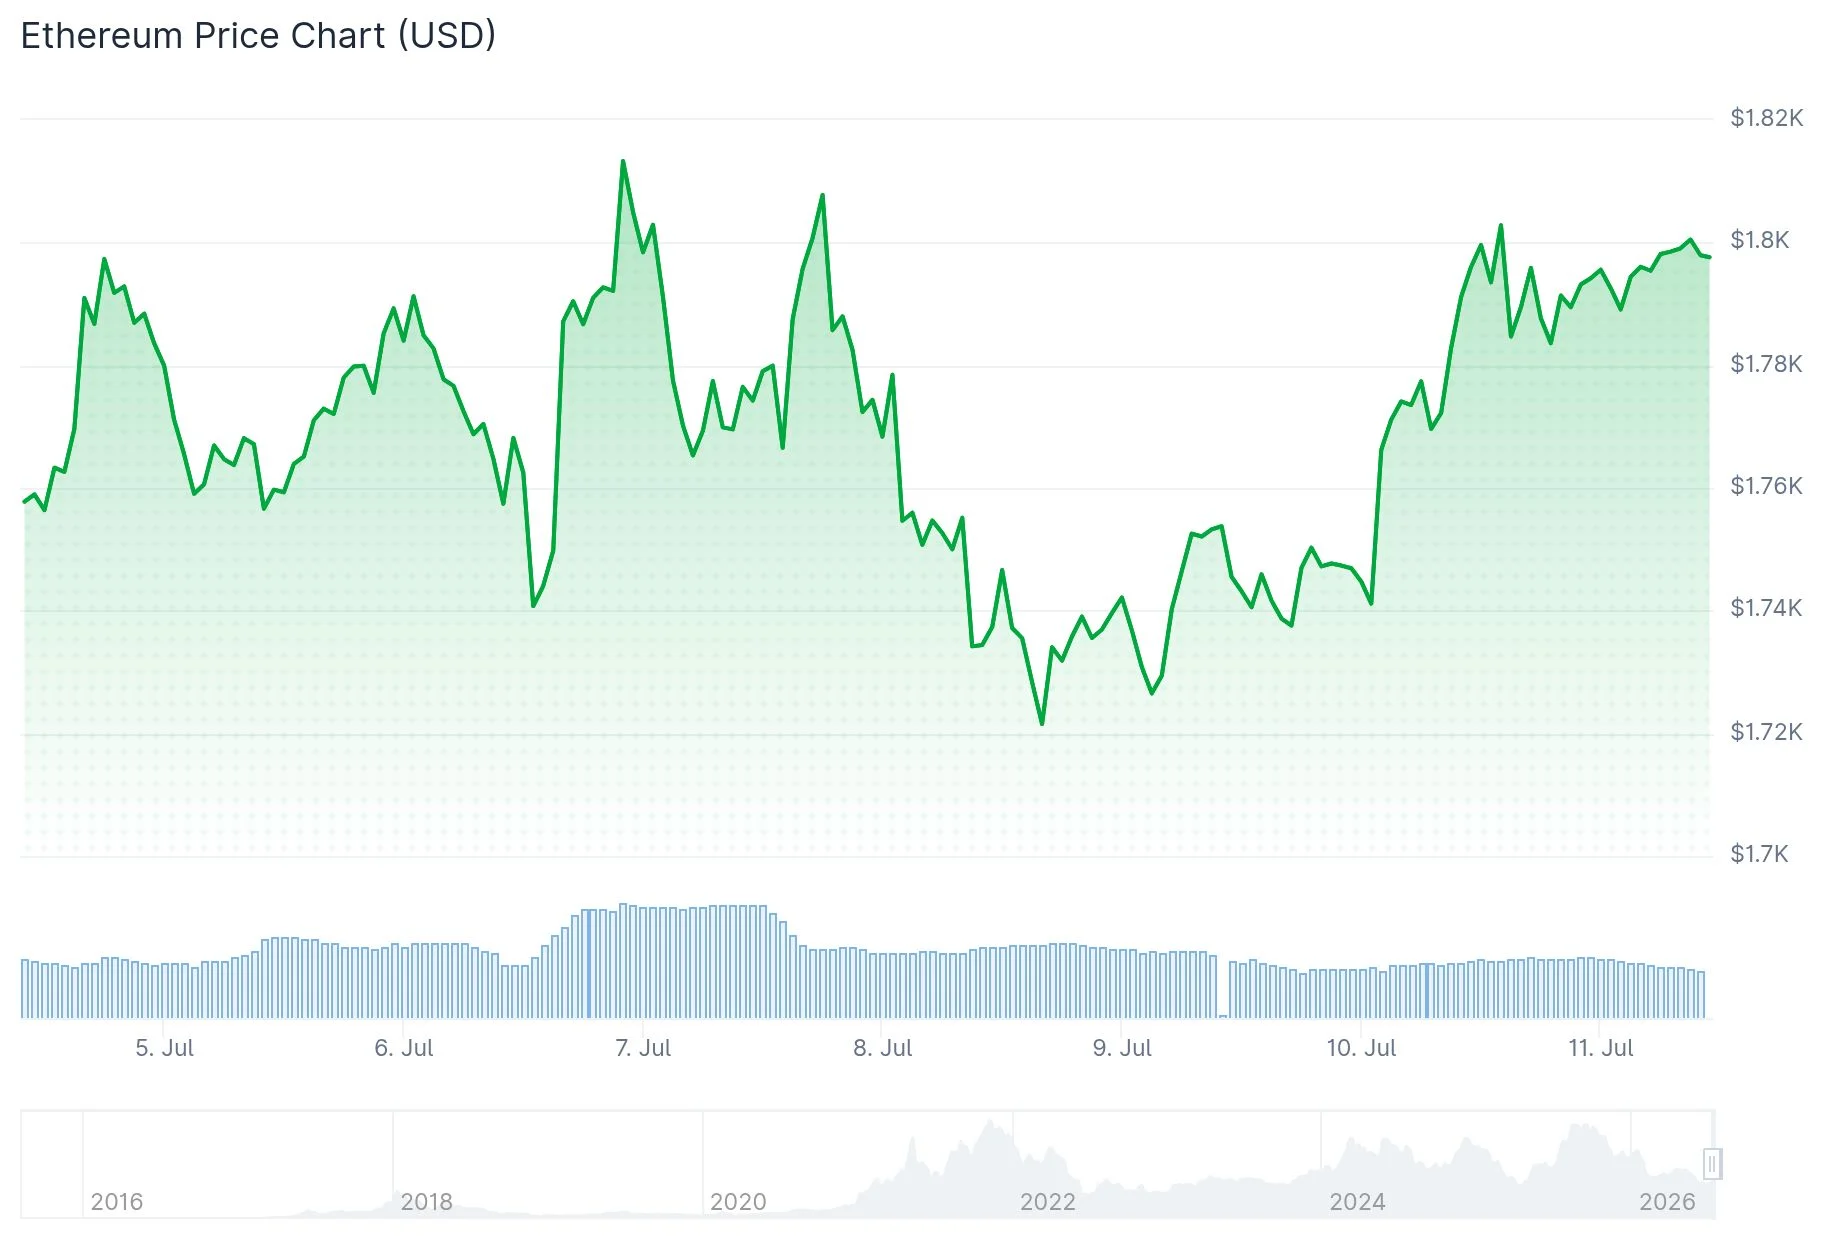
ETH recorded a 3.09% increase over the past day. Twenty-four-hour trading volume reached $17.08 billion, while market capitalization stands at $216.79 billion, based on CoinMarketCap figures.
Cryptocurrency analyst Ted observed that ETH maintaining levels above $1,750 demonstrates technical strength. He suggests that consistent buying pressure in spot markets could drive prices into the $1,850–$1,900 territory.
Should ETH successfully breach this resistance band, additional buying interest could emerge and reinforce the ongoing recovery pattern. Conversely, falling beneath $1,750 would undermine the constructive outlook.

Futures Markets and Blockchain Metrics
ETH futures open interest expanded 3.63% to $24.65 billion. When open interest and price both rise together, market participants typically interpret this as a constructive development.
Derivatives trading volume contracted 6.21% to $28.76 billion. This decline suggests market participants are maintaining their positions rather than executing frequent trades in the near term.
The weighted funding rate for open interest registers at 0.0042%, remaining in positive territory. This indicates a tilt toward long positions among traders, though excessive leverage has not accumulated.
Analyst Ali Charts highlighted on X that ETH’s MVRV ratio has declined beneath 0.8, placing it within what he characterizes as “deep accumulation territory.” He referenced that this threshold was touched three times previously — December 2018, March 2020, and June 2022 — with each instance preceding a price floor before subsequent recovery.
Expert Technical Perspectives
Stephen Suttmeier, previously serving as Head of Technical Strategy at Bank of America, suggested ETH could be establishing a “tactical bottom.” According to his assessment, maintaining support above the $1,690–$1,700 zone reinforces this interpretation.
He further noted that a convincing break above $1,800 and the 50-day moving average could unlock movement toward the 200-day MA positioned near $2,200. Such a move would deliver approximately 25% gains from present price levels.
Fundstrat’s Tom Lee echoed Suttmeier’s technical analysis, providing additional credibility to the constructive chart structure.
However, selling pressure directed toward exchanges has intensified since March. CryptoQuant documented a 6% spike in ETH flowing to exchanges recently, creating friction around the $1,800 mark.
Large holder distribution continues unabated. Significant stakeholders have been decreasing their positions throughout the recent price recovery.
Regarding investment products, a five-day streak of positive net flows concluded Thursday with a $52 million net withdrawal. This reversal correlated with escalating Iran-U.S. geopolitical tensions and instability in bond markets.
ETH is currently trading marginally beneath the $1,800 threshold that market analysts have designated as the critical near-term catalyst.
