



Quick Summary
- Solana has declined 3% on Wednesday, approaching critical support at the 50-day EMA level of $76.67
- ETF capital inflows plummeted to just $1.67M on Tuesday from $8.36M the previous session
- Futures Open Interest contracted 4% over the past day to $5.31 billion, signaling waning trader engagement
- Crypto analyst Ali Charts cautions that failure to break through the $79–$85 resistance could drive SOL down to $53
- Market participants Scient and Ryker are monitoring the $74–$77 support range as a critical demand zone
Solana (SOL) has retreated 3% during Wednesday’s trading session, continuing a correction that started following a rejection near the $83.94 long-term resistance trendline.
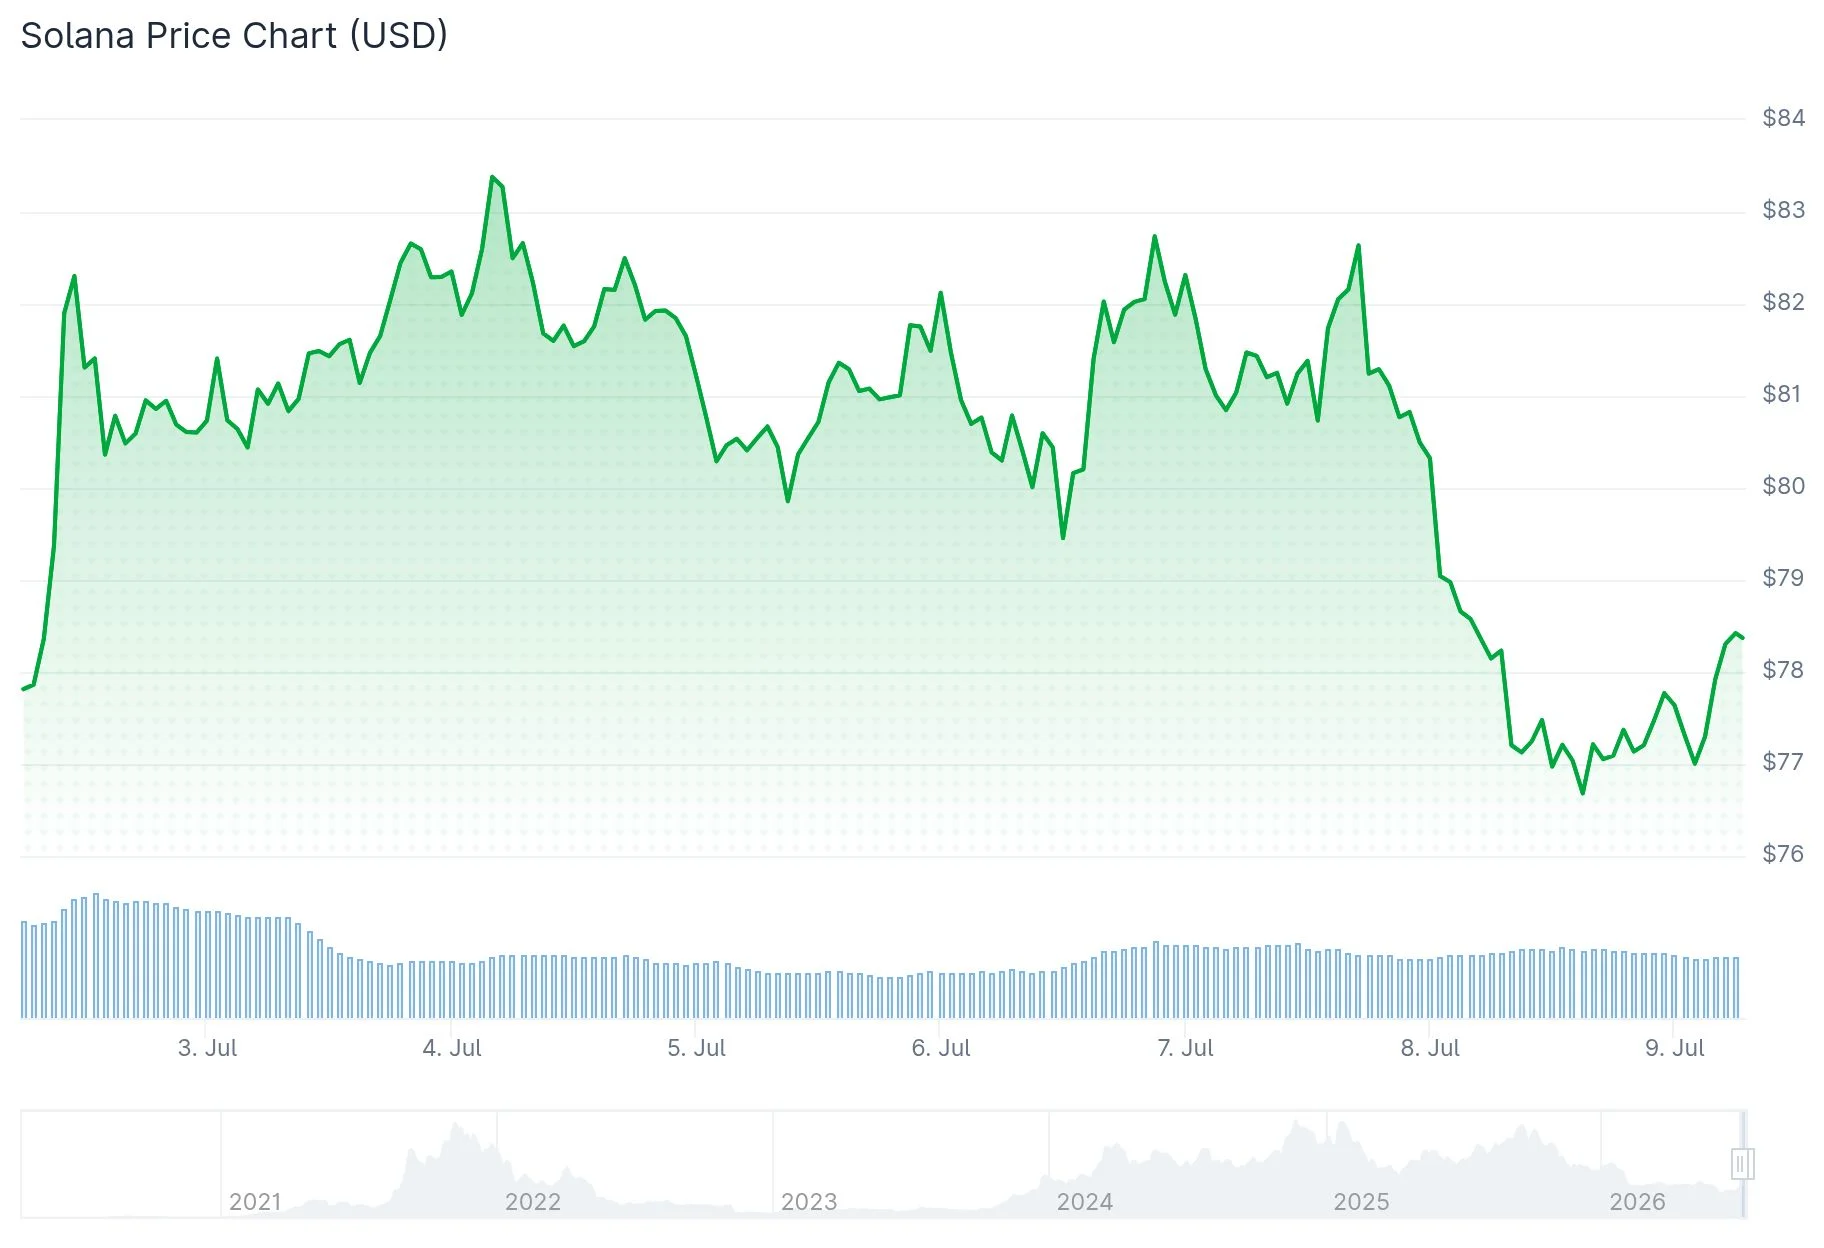
This downward movement has pushed SOL toward a crucial technical floor at $76.67, marked by the 50-day Exponential Moving Average (EMA).
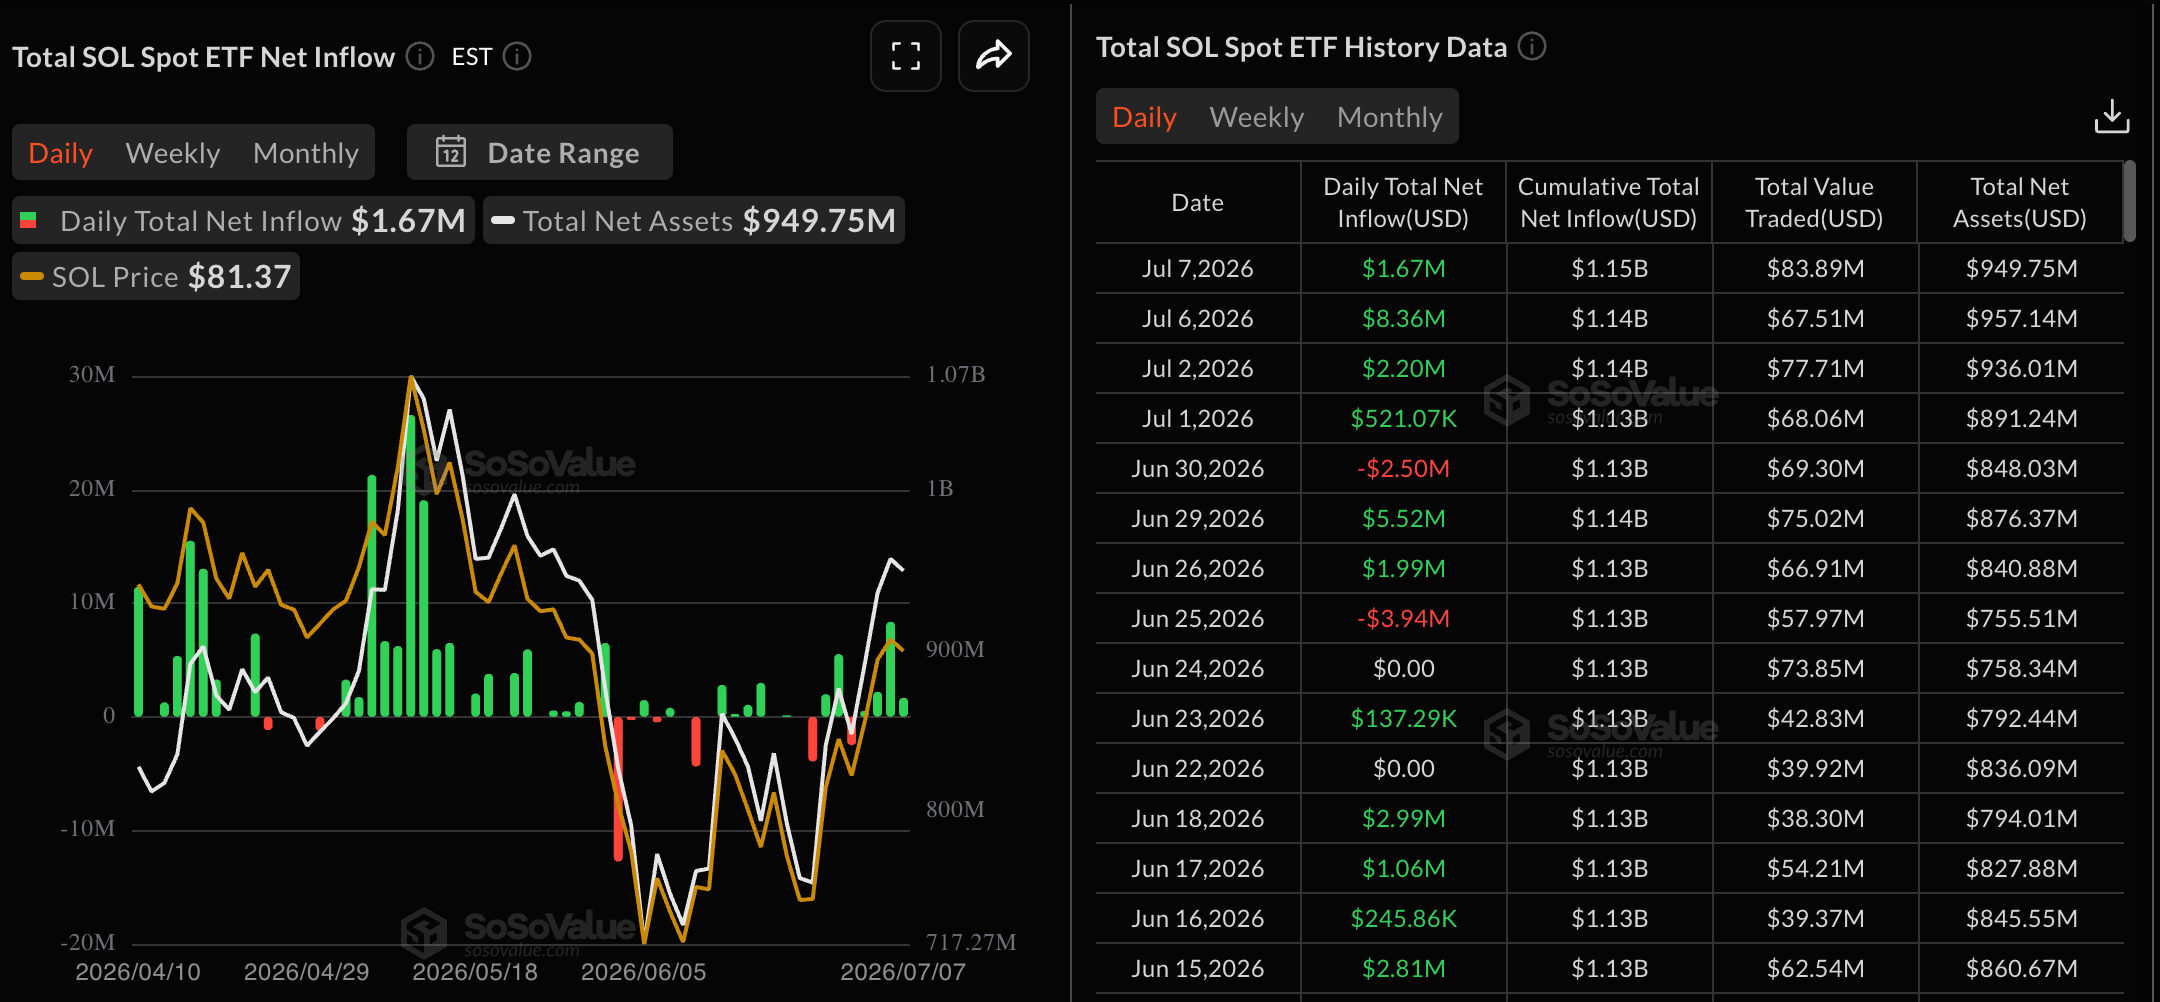
Institutional appetite for SOL has cooled considerably. Exchange-traded fund inflows registered only $1.67 million on Tuesday, representing a significant decline from Monday’s $8.36 million, per Sosovalue tracking data.
Futures Open Interest in SOL contracts decreased 4% during the last 24-hour period to $5.31 billion, according to CoinGlass metrics. Daily trading volume similarly contracted 8% to $8.66 billion.

Funding rates currently sit at 0.0029%, climbing from the prior day’s -0.0042%. This reversal suggests market participants remain uncertain about near-term direction rather than committing to either side.
SOL continues trading substantially beneath the 200-day EMA positioned at $95.51. This distance maintains the overall trend in neutral territory rather than clearly bullish.
Bearish Momentum Builds Beneath $83.94 Resistance
The MACD indicator is trending downward toward its signal line, threatening a bearish crossover should buying interest continue weakening. The RSI has fallen to 54, indicating diminishing bullish momentum.
Immediate support rests at the 50-day EMA of $76.67, aligned with the 50% Fibonacci retracement level of $76.92. A confirmed break below this confluence zone could trigger a move toward $60.13, representing approximately 22% downside.
Cryptocurrency market analyst Ali Charts highlighted a concentrated supply wall between $79 and $85 in a post on X. Based on on-chain URPD (UTXO Realized Price Distribution) analysis he presented, approximately 105 million SOL changed hands within this price band.
He emphasized that successfully clearing this resistance cluster would establish a path toward $100 initially, followed by $127. However, rejection at this level could intensify downward pressure, potentially driving SOL toward $53.
Market Participants Focus on $74–$77 Support Region
Trader Scient disclosed that he began accumulating his SOL position following the pullback into the $74–$77 price range. He characterized this zone as a previous breakout area and positioned limit orders extending down to $74.
Should buyers successfully defend this support level, the initial upside objective lies around $93. The broader target zone stretches between $115 and $127.
Trader Ryker is drawing parallels between the current 2026 price action and Solana’s 2023 consolidation pattern, which preceded a substantial rally. He accumulated SOL at $40 during that previous cycle and exited at $122.
Ryker indicates he’s currently waiting for a more favorable entry opportunity before re-establishing positions. He suggests the current structure may require additional time to develop before the next significant upward movement materializes.
SOL ETF capital inflows on Tuesday totaled $1.67 million, marking the weakest performance in the past two trading days.
