
 Drops 22% — Should Investors Consider This Dip?")
Quick Overview
- Hyperliquid has declined 22% from its peak of $76.9, currently hovering near $66
- Critical support territory lies between $50 and $54, coinciding with the 50-day exponential moving average
- Futures open interest has contracted from $2.2 billion down to $1.73 billion, indicating waning participation
- While spot market pressure is diminishing, the spot CVD maintains a significant negative reading of -$95 million
- Market commentator Altcoin Sherpa identifies the $55–$64 band as favorable for accumulation, targeting $100
The native token of Hyperliquid has experienced a 22% retracement from its all-time peak of $76.9 established last week. HYPE currently changes hands around $66 while market participants evaluate whether the bullish momentum that began in January remains sustainable.
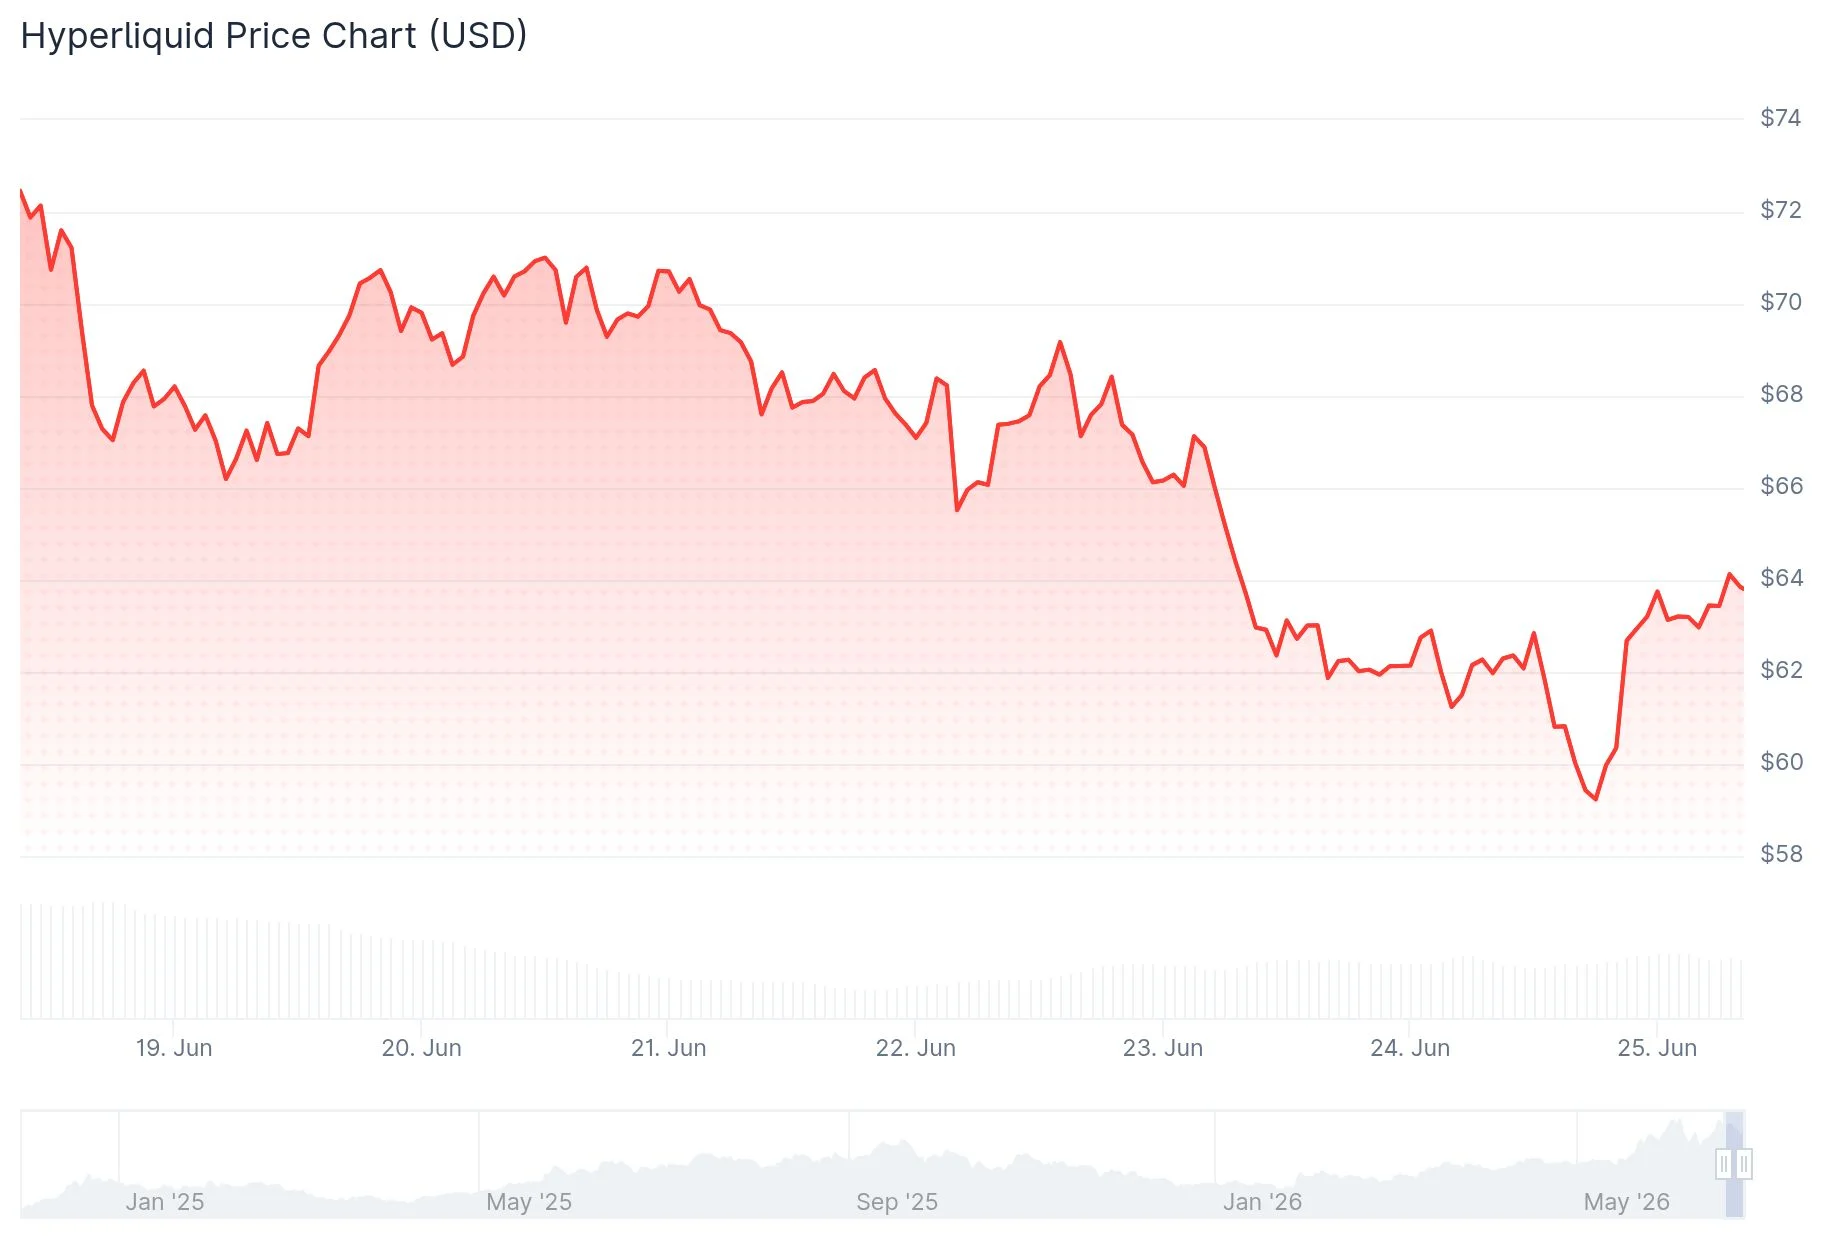
The pullback materialized after encountering resistance at the record high near $76. During midweek action, HYPE dipped beneath the $60 threshold before finding equilibrium. The 50-day exponential moving average, which has provided consistent support during the March rally, is now facing another test.
Futures market indicators continue to suggest optimism. According to CoinGlass data, the long-short ratio stands at 1.03, accompanied by positive funding rates of 0.0042%. This configuration indicates that long position holders are compensating short sellers, reflecting continued bullish sentiment among leveraged traders.
Diminishing Pressure in Spot Markets
Selling intensity in spot markets has subsided compared to early June activity. The aggregated spot cumulative volume delta (CVD) has recovered from recent lows, although it maintains a substantially negative position around -$95 million. When prices tumbled from $76 during the first week of June, spot selling reached $110 million.

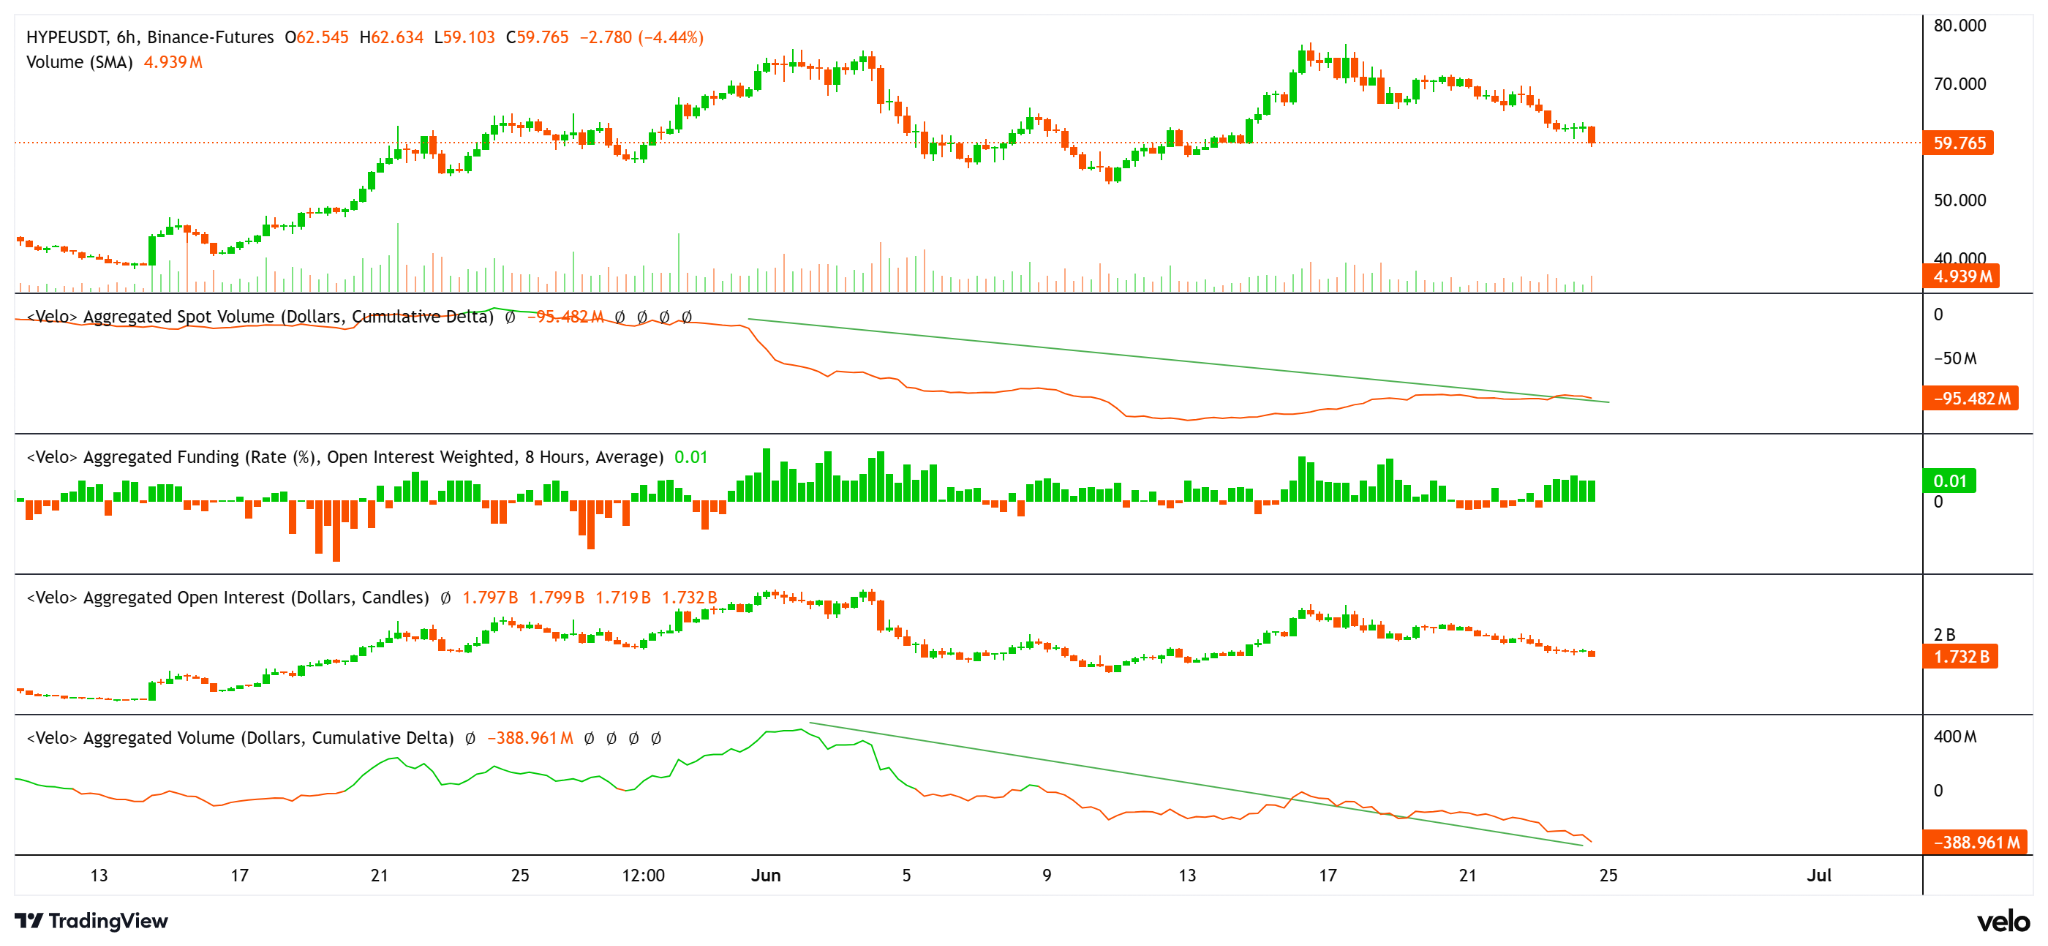
Derivatives markets present a more reserved outlook. Open interest has experienced a significant decline from $2.2 billion to $1.73 billion. The derivatives CVD registers approximately -$389 million. This suggests market participants are reducing exposure instead of establishing fresh positions.
Social media engagement surrounding HYPE has been trending downward since June 17, currently measuring 0.175% based on Santiment metrics. Increased retail involvement following the record highs has emerged, which certain analysts interpret as a potential cautionary indicator for short-term price action.
Institutional spot ETF activity has remained subdued throughout the week, with SoSoValue reporting minimal flows.
Critical $50–$54 Support Territory Demands Attention
The most significant support region extends from $50 to $54. This zone aligns with the ascending 50-day EMA and an unfilled daily fair-value gap. Should HYPE close below $53 on a daily basis, it would mark the first bearish structural shift in the daily timeframe for the current year.
Beneath this level, the 100-day EMA positioned at $51.57 represents the next defensive line, with $49 following thereafter. Additional support exists around the $38 level.
Cryptocurrency analyst Altcoin Sherpa offered perspective on the current market structure: “HYPE, I think anywhere in the 55–64 area is a pretty good place to accumulate this one. I think it goes to $100 later this year personally and is still the best altcoin…but it’s going to also depend a lot on bitcoin IMO.”
Regarding upside potential, a daily close exceeding $74.60 would clear the pathway toward fresh record territory. The 50-day EMA currently registers at $58.94, the 100-day at $51.57, and the 200-day at $44.68—all positioned below current price action, supporting the continuation of the broader uptrend.
The Relative Strength Index rests near 53 on the daily timeframe, while the MACD displays slight negativity, indicating that momentum has moderated without fully transitioning to bearish territory.