
 Stock: Bulls Face Critical $78 Test or Risk Plunge to $60 and Below")
Key Takeaways
- Solana trades around $68–$69 following a 5–7% decline over 24 hours, hovering near important support levels
- Bulls face a crucial test at the $75–$78 resistance zone, which must be reclaimed to prevent additional downside
- A major whale initiated a 20x leveraged short position on 554,680 SOL (approximately $38 million) around $69, intensifying bearish sentiment
- Breakdown below $60 could trigger a more significant correction toward the $40–$30 territory, according to market analysts
- Technical indicators like the MACD histogram suggest downward momentum may be decelerating at current price levels
Solana has experienced a significant pullback during the past day, declining over 5% to hover around the $68–$69 zone. The cryptocurrency is trading close to its daily bottom, with bears maintaining control over near-term price action.
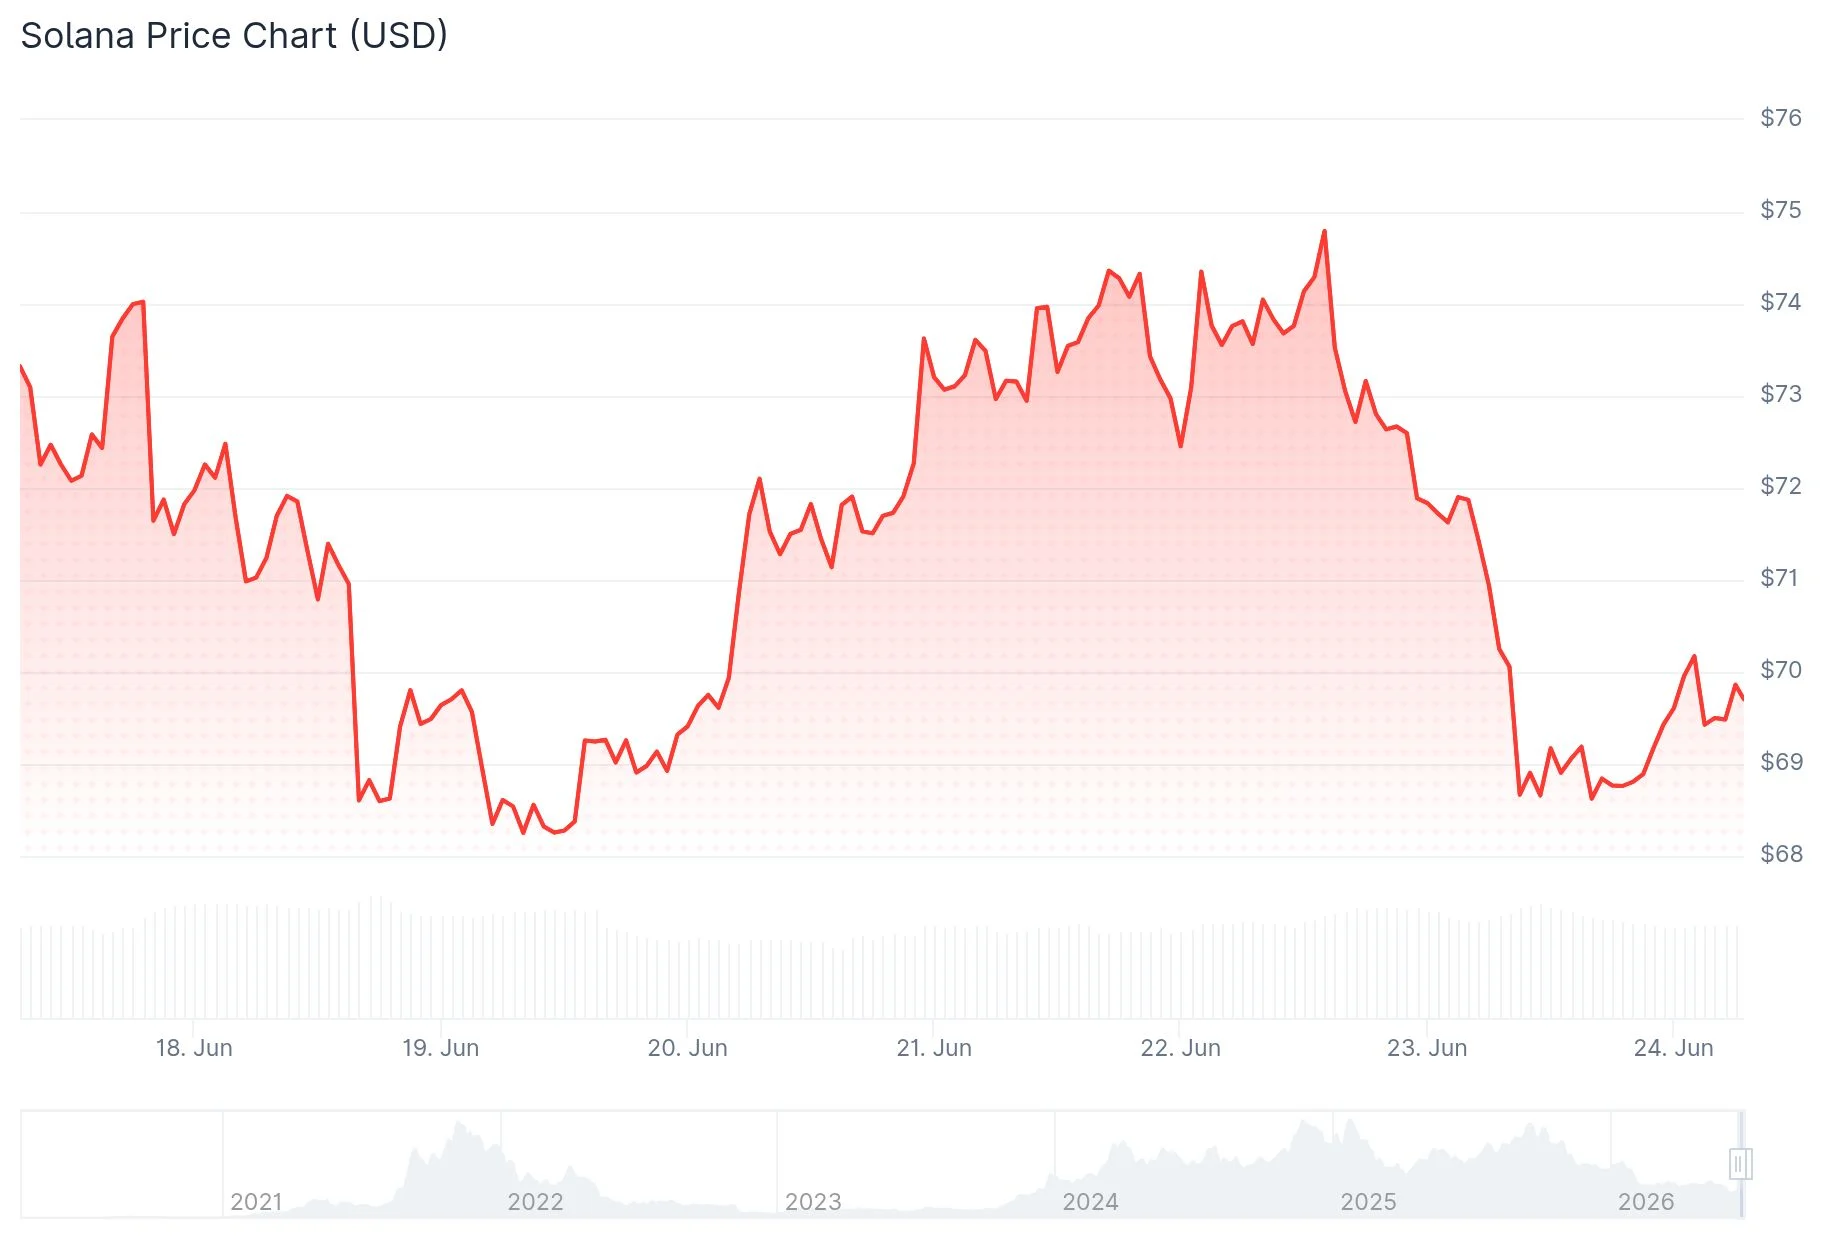
Currently, SOL records a 24-hour trading volume of approximately $5.07 billion alongside a market capitalization of about $39.92 billion. The daily price swing has ranged from a low of $68.41 to a high of $72.80.
Although the token attempted an earlier recovery during the trading session, it couldn’t maintain momentum above the $70 mark, resulting in a retreat toward the session’s lower boundary.
Major Whale Initiates Significant Short Position Near $69
According to on-chain tracking platform Lookonchain, a prominent whale established a 20x leveraged short trade involving 554,680 SOL tokens, valued at roughly $38.15 million. The position was entered near the $69.23 price point, with breakeven calculated around $69.19.

Given that SOL continues trading near this threshold, the short position remains marginally profitable. As long as the price stays beneath the $69–$70 range, this substantial bearish bet could continue applying downward pressure on market psychology.
Cryptocurrency analyst Sjuul from AltCryptoGems observed on June 22 that bearish forces remain dominant on Solana, though buyers are attempting localized defense. He emphasized that successfully flipping the $78 level represents the critical challenge for bulls, identifying it as the catalyst for a “power of 3” expansion pattern — while cautioning traders about taking long positions before that threshold is secured.
Regaining $70 followed by $72 would start alleviating some bearish momentum, but until those levels are conquered, attention remains fixed on downside targets at $68, $64, and $60.
Critical Resistance Zone Between $75–$78 Demands Attention
Market watchers have concentrated their focus on the $75–$78 price range. This area has emerged as the decisive resistance battleground for Solana. Should SOL successfully breach and sustain above $78, the subsequent upside objectives include $85 followed by the $90 region.
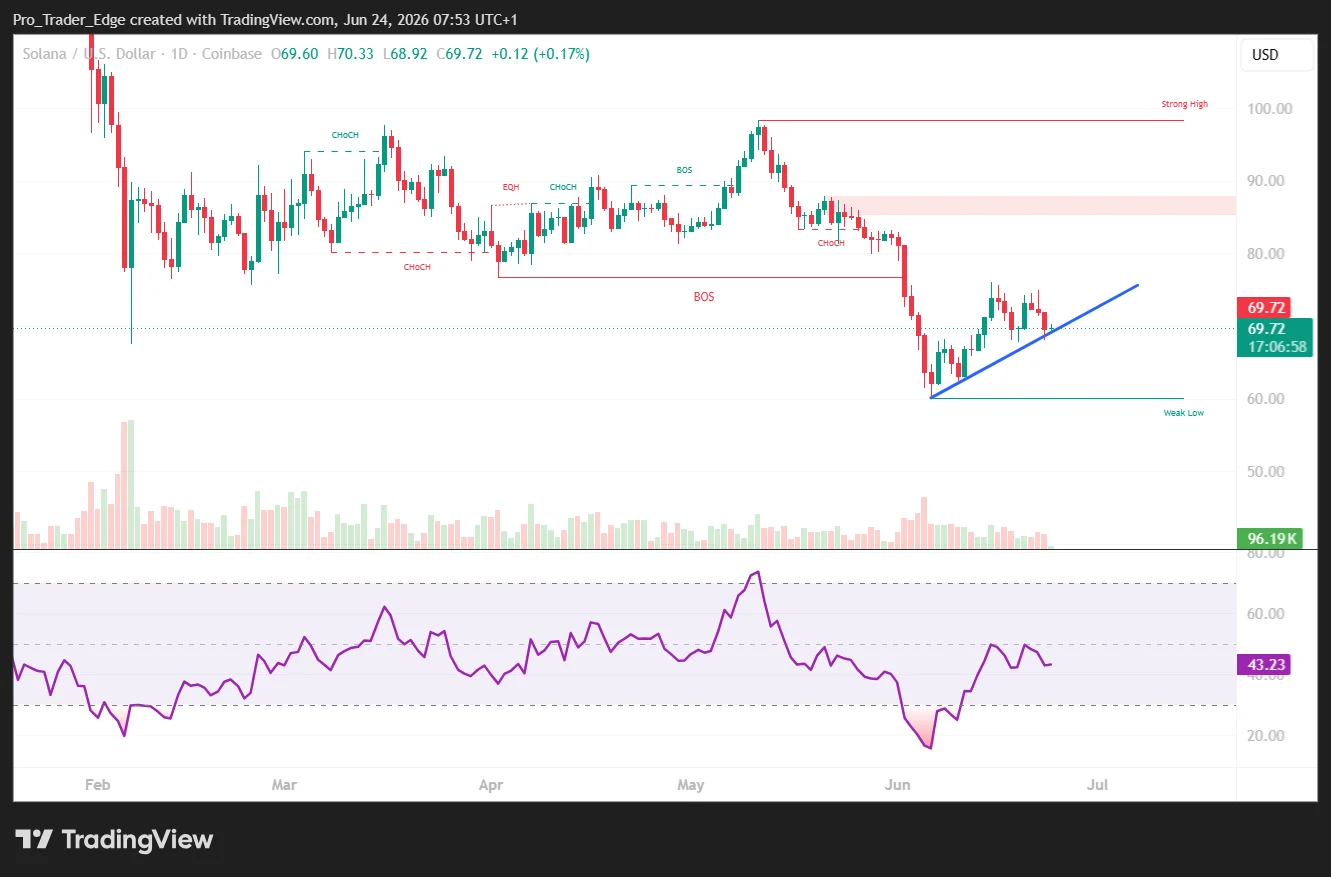
Conversely, rejection at this zone would preserve the bearish framework. Failure to overcome this resistance could drive prices back down to the $64–$60 corridor.
Should the $60 support level fail, extended-term cycle analysis identifies a potential demand zone spanning $55 to $40 where buyers might attempt establishing a foundation.
From a technical standpoint, the MACD indicator shows a reading of -1.81 compared to the signal line at -2.59, producing a histogram value of +0.79. This configuration implies selling pressure might be moderating, though a legitimate reversal would require breaking above the middle Bollinger Band positioned near $68.72.
The upper Bollinger Band rests at $75.69, coinciding with the resistance area identified by market technicians.
Solana has maintained a fragile trend pattern since October 2025, with prices remaining beneath the broader $80–$90 reclaim zone that would need to be surpassed for establishing a healthier trajectory. Latest market data places SOL near $69, just under the $70 threshold that bulls must secure as an initial recovery step.