
 Stock Surges Past $64K Amid Switzerland Diplomatic Talks")
Key Points
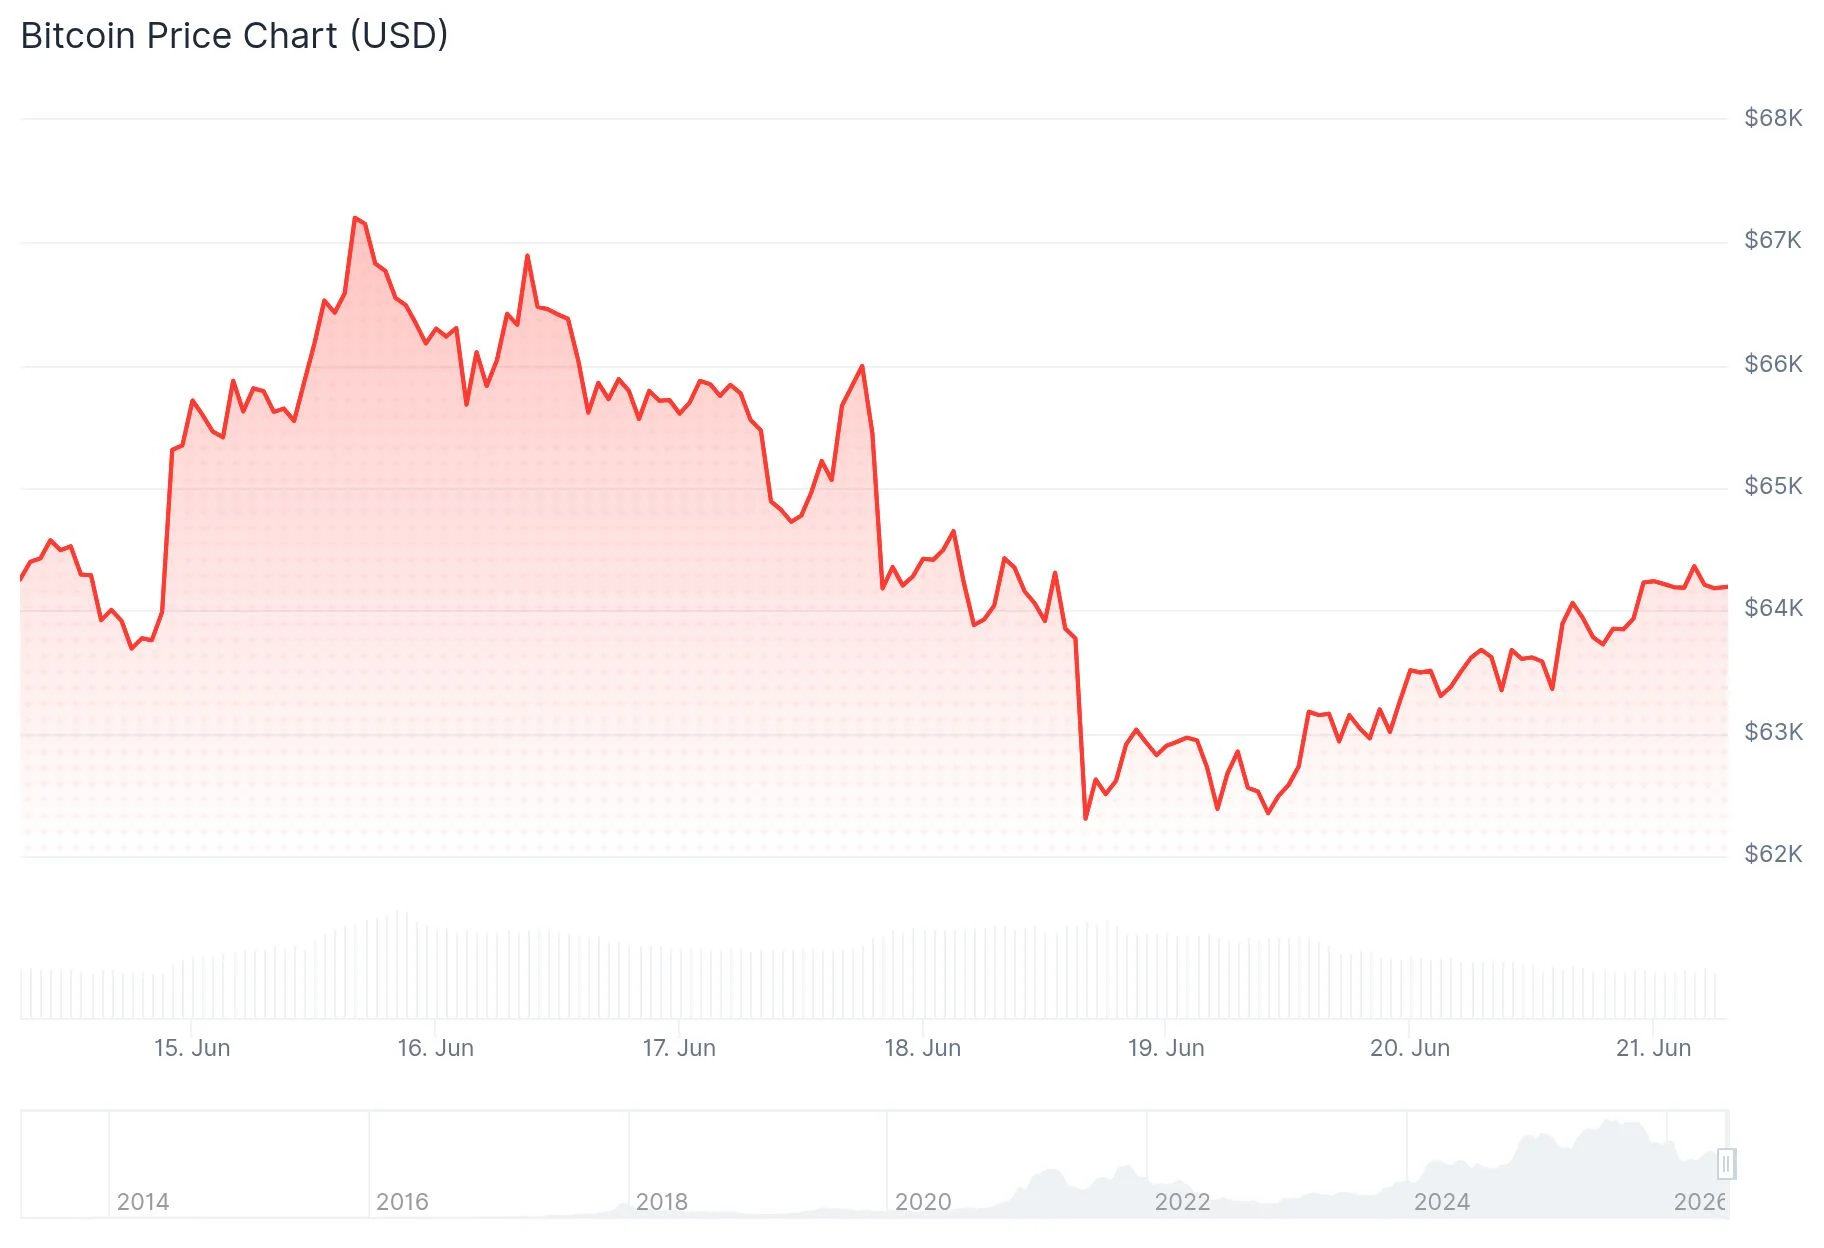
- BTC recovered above the $64,000 threshold on Saturday, June 20
- Vice President JD Vance’s Switzerland travel announcement coincided with the price bounce
- The cryptocurrency maintains position above the critical 200-week simple moving average
- Technical analyst SuperBro identifies similarities to Bitcoin’s 2015 bottom pattern
- Critical resistance zone established at $63,800–$64,000, while support holds at $61,650
The leading cryptocurrency surged past the $64,000 mark on Saturday, June 20, following announcements that US Vice President JD Vance would head to Switzerland for diplomatic discussions with Iranian representatives. Trading data showed BTC at $64,107, reflecting a 1.63% daily increase.
In a Fox News interview, Vance indicated his departure would occur “within the next couple of days” to support US negotiators Jared Kushner and Steve Witkoff, who had already arrived in Switzerland. Sources suggest Qatar and Pakistan are playing facilitator roles in the diplomatic process.
This development followed a turbulent week marked by negotiation doubts. Previous reports indicated discussions had hit roadblocks, with a planned Friday meeting being delayed. Nevertheless, major media outlets such as CNN and Axios verified that Witkoff was traveling to Switzerland to revitalize the negotiation efforts.
Market analyst Daan Crypto Trades highlighted on X platform that BTC’s rebound originated from the Weekly 200-day moving average combined with the 0.618 Fibonacci retracement point. According to his assessment, maintaining the approximately $62K zone through the weekly close is essential for bulls, with a breach below signaling short-term bearish pressure. He projects that surpassing the local peak around $67K could propel prices toward $73K.

Technical Analysis Framework
Analyst SuperBro highlighted on June 19 that Bitcoin’s present chart formation bears striking resemblance to its 2015 base pattern. The digital asset trades approximately 5% higher than its February trough while maintaining position above the 200-week SMA.
SuperBro identified multiple technical indicators supporting bullish momentum: a positive 10/20 SMA weekly crossover signal, Stochastic RSI climbing above 99, RSI advancing from sub-30 territory to above 45, and six straight weeks of higher lows. The current retracement measures under 2% from the previous low, mirroring 2015 market behavior.
However, he emphasized the 200-week SMA serves as the critical threshold. Maintaining position above this level preserves reversal potential, while falling below would significantly complicate recovery prospects.
Critical Price Zones
Analyst EliZ provided specific parameters for Bitcoin’s immediate trading boundaries. The resistance barrier stands at $63,800–$64,000, while support holds at $61,650. His assessment indicates no compelling trade configuration currently exists, with the next significant movement dependent on which boundary fails first.
He further described a possible scenario involving a descent to the lower support area, liquidity sweep, followed by recovery if purchasing pressure materializes.
Current market data shows BTC trading at $63,552 with $27.59 billion in 24-hour volume and a market capitalization of $1.27 trillion, representing a 1.69% gain over the past day.