
 Stock Reaches Historic Oversold Territory at $1,700 Level")
Key Takeaways
- ETH currently hovers near $1,665–$1,680, experiencing a 0.63% decline over 24 hours with market capitalization at $201 billion
- Crypto analyst Ash Crypto reports ETH has reached its most oversold state in its entire trading history
- Current monthly RSI figures fall below those recorded during the 2018 and 2022 bear cycle bottoms
- The cryptocurrency has recovered from $1,603 lows and established a bullish trendline anchored at $1,665
- Critical resistance zone identified between $1,740–$1,780, with potential upward targets at $1,850 and $1,920
Ethereum is currently positioned between $1,665 and $1,680 following a short-term rebound from its swing bottom at $1,603. The digital asset has declined 0.63% in the past day, registering a 24-hour trading volume of $10.20 billion alongside a market capitalization of $201.17 billion.
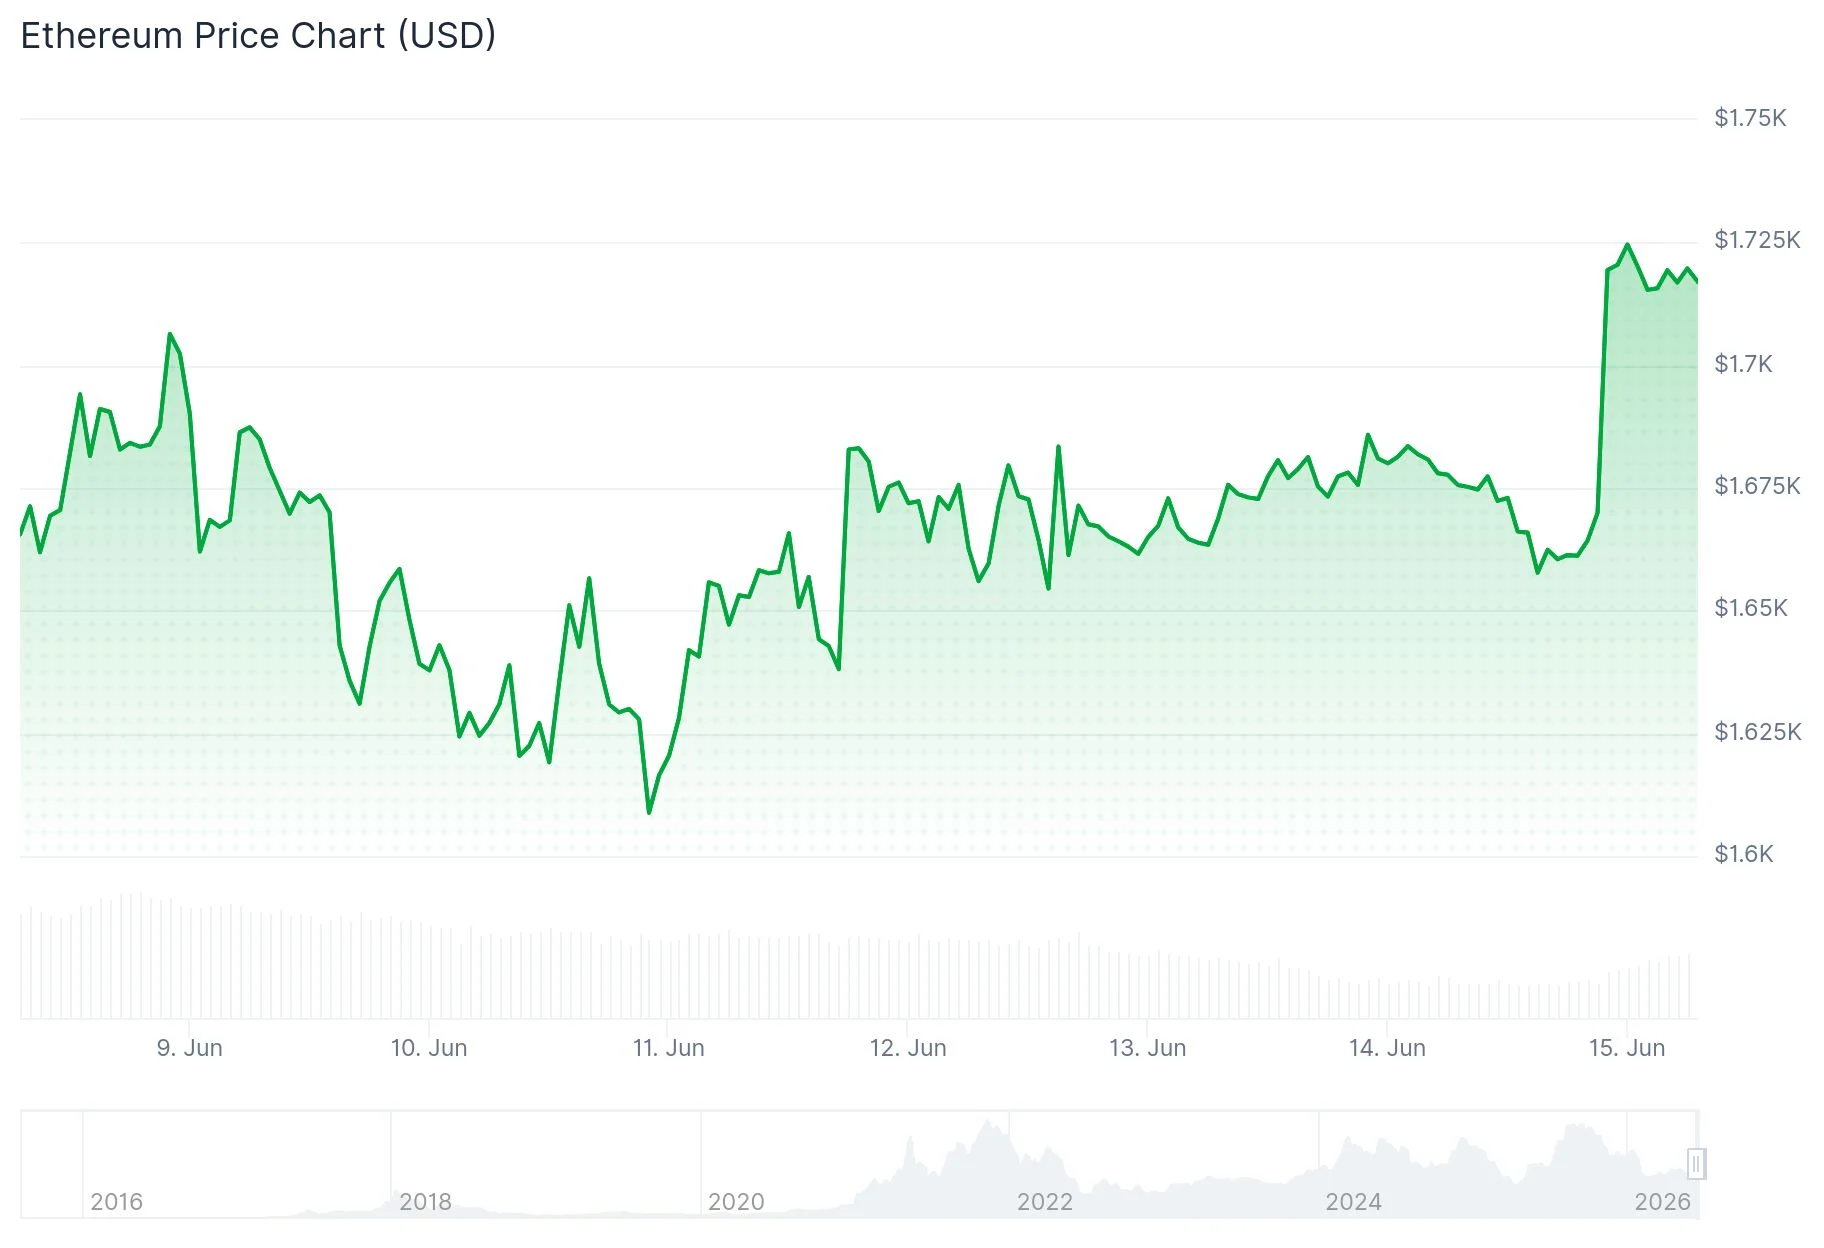
The cryptocurrency surged to an intraday peak of $1,731 before experiencing a pullback. It currently remains consolidated above the 23.6% Fibonacci retracement marker derived from the $1,603 to $1,731 price movement.
On June 14, 2026, cryptocurrency technical analyst Ash Crypto published observations indicating Ethereum has reached “the most oversold it has ever been” according to historical market metrics. His analysis highlighted that ETH has plummeted approximately 70% from its prior record high and currently trades at valuations not witnessed in four years.
Ash Crypto further emphasized that the monthly Relative Strength Index presently sits below levels documented throughout the 2018 and 2022 bearish market cycles. He drew parallels to June 2022, when Ethereum established a bottom after an 82% decline from its zenith.

Market analyst Ted Pillows contributed additional perspective, stating that ETH has successfully breached its near-term downward trajectory. According to his assessment, a confirmed move beyond $1,700 could catalyze an upward movement targeting the $1,850–$1,900 price range.
Critical Price Levels Under Observation
ETH maintains its position above the 100-hourly Simple Moving Average alongside a constructive trend line providing support at $1,665. This trend line coincides with the 50% Fibonacci retracement calculated from the $1,603 to $1,731 price swing.
The nearest resistance barrier appears at $1,720, subsequently followed by $1,740 and $1,780. A successful breach above $1,780 could propel ETH toward $1,850. Additional upside objectives are established at $1,880 and $1,920.
Conversely, inability to overcome the $1,740 threshold may result in ETH retreating toward the $1,680 support zone. A breakdown beneath $1,665 would activate $1,650 and subsequently $1,620 as downside targets, with $1,600 serving as the primary support foundation.
Technical Indicators Signal Potential Momentum Change
The MACD histogram currently displays a positive value of 3.15, indicating diminishing downward pressure. The MACD line registers at -126.82, while the signal line stands at -129.97, suggesting a subtle bullish divergence pattern.
The Bollinger Bands previously witnessed Ethereum testing the lower boundary near $1,456.90 during intensive selling activity. The $1,802.52 threshold now represents a significant resistance level according to this indicator.
ETH presently trades above $1,680 while maintaining the 100-hourly moving average as purchasing activity attempts to preserve the near-term recovery trajectory.