
 Stock: Why the $1,700 Mark Is Critical for ETH’s Next Move")
Quick Overview
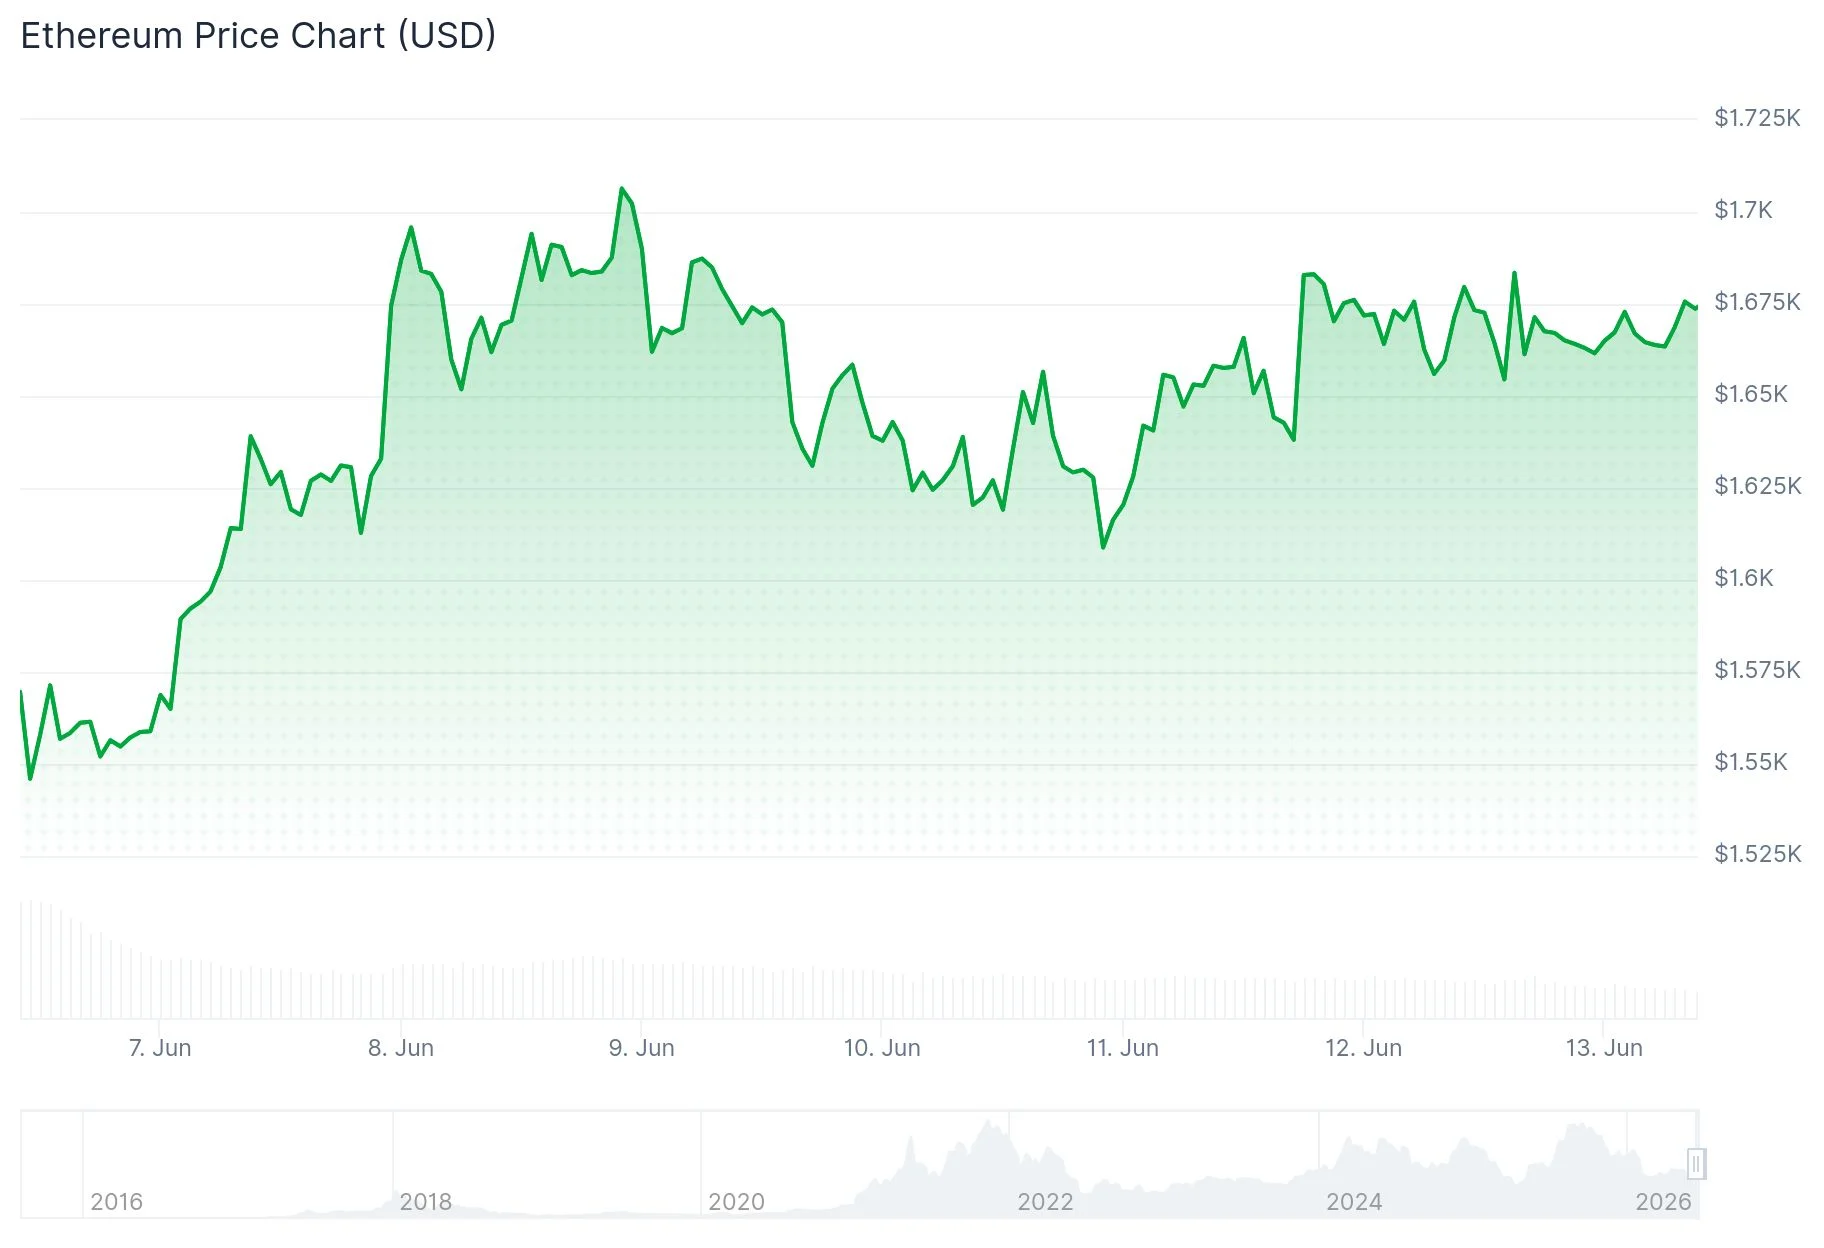
- ETH currently sits near $1,670, showing a modest 24-hour increase of slightly over 1%, though bearish technical patterns persist
- Technical analysis reveals a bear flag formation keeping downward pressure on ETH unless price surpasses $1,700
- Clearing the $1,700 threshold could trigger a rally toward $1,850–$1,900; rejection risks a decline to $1,500
- Approximately 500,000 ETH tokens valued at roughly $800 million exited exchanges in the past week, potentially signaling accumulation
- Spot Ethereum ETFs experienced $16 million in net outflows on Thursday, marking the third consecutive day of negative flows
Ethereum’s price action has displayed tentative stabilization following significant selling pressure, though the dominant technical structure continues to favor bears. At press time, ETH was exchanging hands around $1,670, reflecting a modest 24-hour increase slightly exceeding 1%.
This minor uptick follows a substantial decline from mid-May levels, primarily triggered by escalating geopolitical concerns and broader macroeconomic headwinds. The current recovery appears tentative rather than convincing based on technical indicators.
Cryptocurrency market analyst Ted highlighted that ETH remains confined within a bear flag chart pattern. This technical formation historically suggests additional downside momentum unless the asset successfully escapes its boundaries.
For Ethereum to transition toward a more constructive outlook, price action must establish a decisive daily close above the pivotal $1,700 resistance zone. Successfully breaching this barrier could unlock upside potential toward the $1,850–$1,900 range.

Should this resistance level prove resilient, the probability of renewed downside pressure increases substantially. Under this scenario, the critical $1,500 support zone would emerge as the next logical downside target.
Substantial Exchange Outflows Suggest Potential Accumulation Phase
Market analyst Ali Charts observed on X that approximately 500,000 ETH tokens — representing roughly $800 million in value — were transferred off centralized exchanges during the preceding seven-day period. Significant outflows from trading platforms often suggest holders are relocating assets to self-custody solutions, which market observers frequently interpret as accumulation behavior.
Blockchain metrics provide additional perspective on network health. The count of active Ethereum addresses contracted to approximately 480,000 on Thursday, declining from 554,000 previously and substantially below the 738,000 recorded in late April.
Declining network participation during attempted price recovery typically indicates insufficient broad-based support for the rally. This type of bearish divergence frequently precedes further corrective moves.
Institutional Product Outflows Compound Selling Pressure
Ethereum exchange-traded funds have recorded consecutive daily outflows extending to three sessions. Thursday’s withdrawal totaled $16 million, following $41 million on Tuesday and $36 million on Wednesday.
Futures markets similarly reflect defensive positioning. Open interest across Ethereum futures contracts declined to $22.98 billion on Friday, retreating from $30.95 billion recorded at June’s beginning.
The MACD indicator registers approximately -138.24, positioned beneath the signal line at -130.37, confirming ongoing bearish momentum. The RSI reads marginally above 30, indicating the asset approaches oversold conditions without yet confirming trend reversal.
ETH trades substantially beneath its 50-day, 100-day, and 200-day exponential moving averages positioned at $2,000, $2,148, and $2,405 respectively. These technical levels constitute formidable overhead resistance barriers.
Current market data shows ETH at $1,688, remaining constrained below the $1,700 threshold with no confirmed bullish signals emerging on daily timeframes.