

Key Takeaways
- Currently priced at $1.12, XRP has declined 3.11% in the last day and 8.91% across seven days
- Technical expert Egrag Crypto identifies a falling wedge formation, noting breakout confirmation requires surpassing the $1.66–$2.00 zone before upside projections activate
- Trading strategist Diana indicates that a push beyond $1.30 accompanied by robust volume would validate bullish momentum targeting $1.65
- Market analyst Ali Charts reports the Tom DeMark Sequential indicator has generated a buy signal for XRP, hinting at possible upward movement
- Critical downside thresholds include $1.09, $0.90, and $0.86 should current support fail to maintain
XRP finds itself in a pivotal support zone at $1.12, with market analysts divided on whether demand can stabilize the price or if additional declines loom ahead.
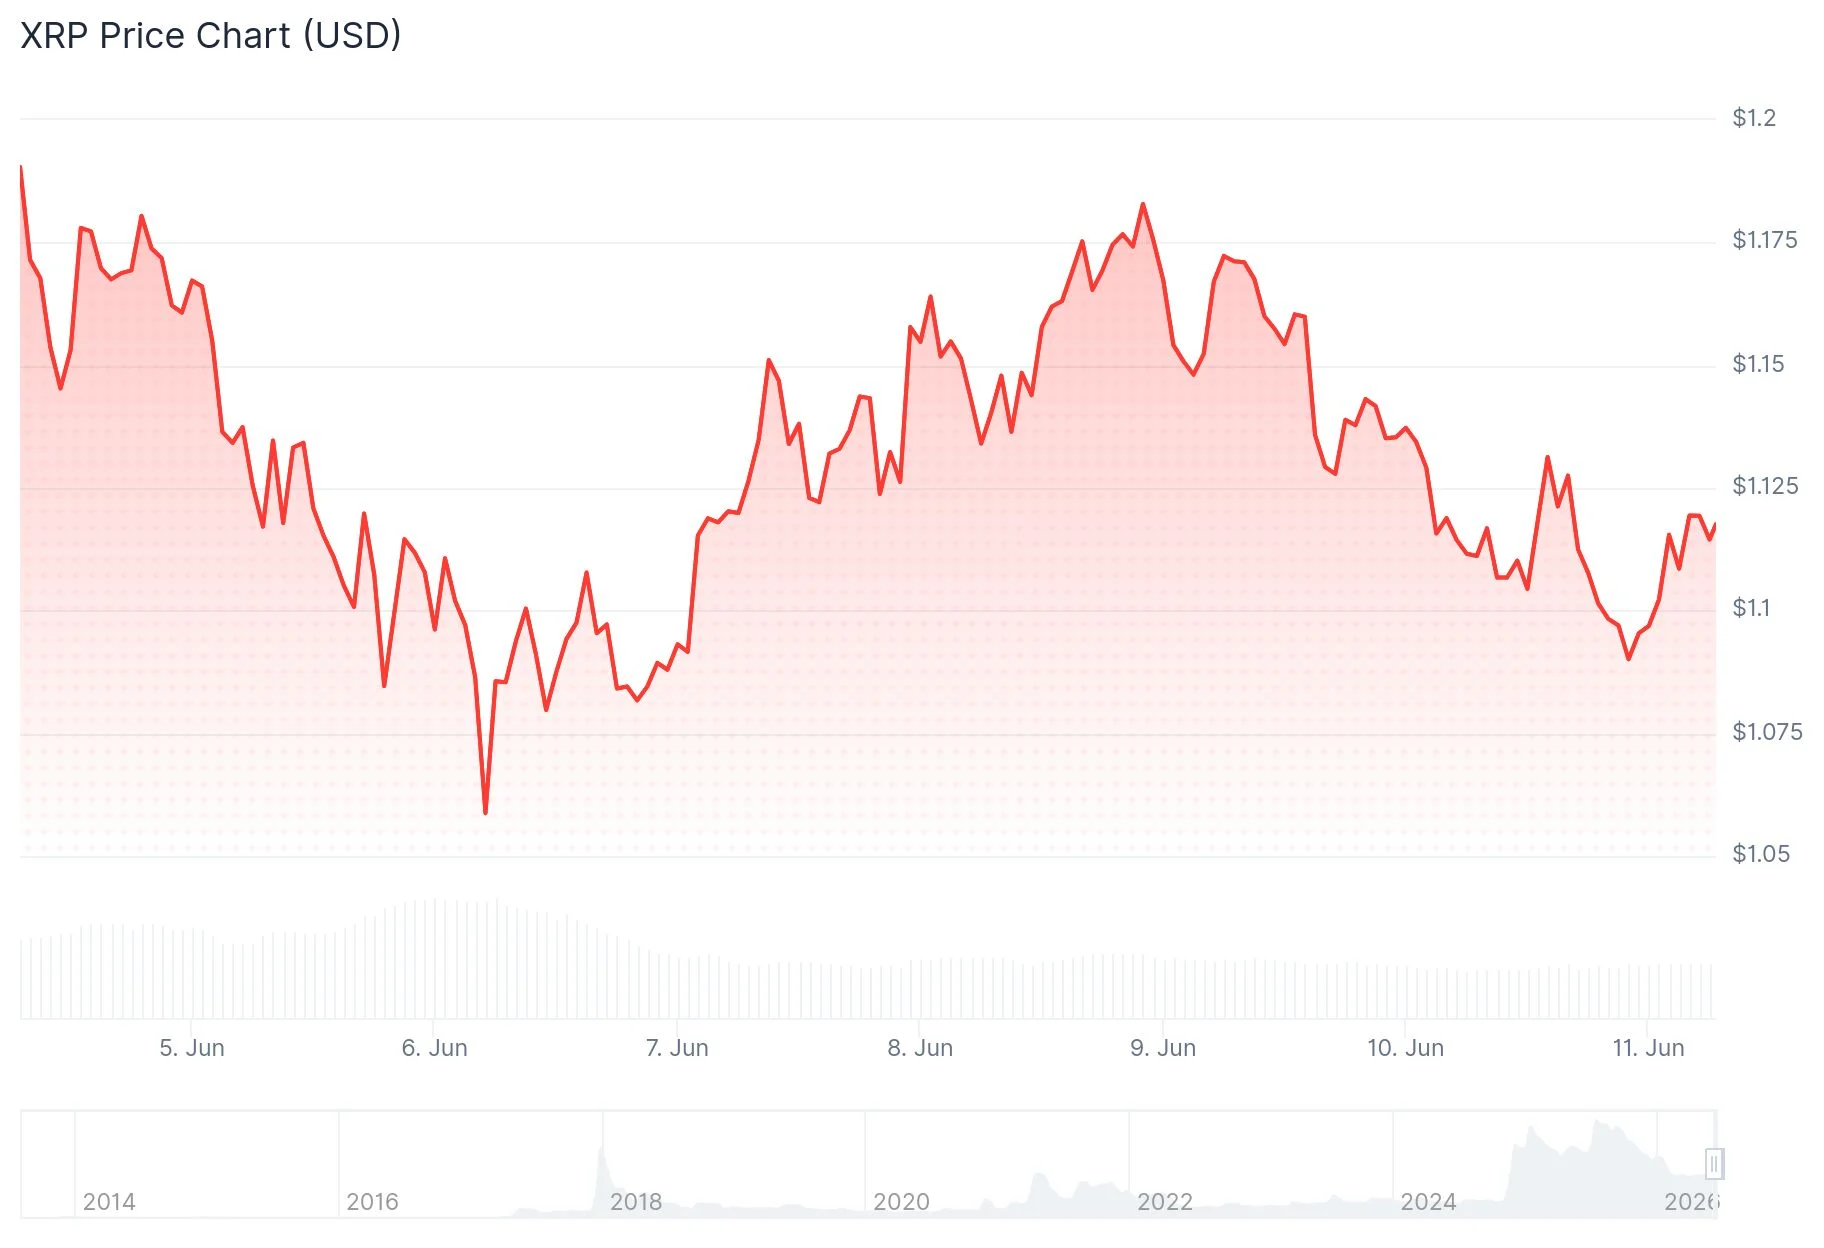
As of this writing, XRP is valued at $1.12, reflecting a 3.11% decrease during the last 24-hour period. Trading volume has contracted by 5.04%, registering $1.84 billion. Throughout the previous week, the digital asset has surrendered 8.91%, per CoinMarketCap data.
The decline materialized after the token struggled to maintain ground above $1.1550. Downward pressure pushed through $1.1420 and penetrated below the 50% Fibonacci retracement calculated from the $1.050 swing bottom to the $1.1862 peak. Currently, XRP operates beneath its 100-hour Simple Moving Average.
Hourly chart analysis reveals a bearish trendline formation with resistance positioned at $1.120. This threshold represents the initial obstacle for bullish participants to overcome.

Critical Overhead Barriers for Bulls
Should XRP mount an advance, the initial significant resistance emerges at $1.1350. Clearing this barrier decisively could pave the way toward $1.1420, followed by $1.1550. Subsequent overhead levels include $1.1650 and $1.1840.
Market observer Diana maintains close surveillance on the $1.25 area. Her analysis suggests XRP rebounded from macro-level support at $1.09 and is currently challenging the $1.20–$1.25 resistance band. She contends XRP must hold above $1.12 and penetrate $1.25–$1.30 with substantial volume to validate bullish conviction.
According to Diana’s framework, a breakthrough above $1.30 would establish a price objective near $1.65. Such a development would alleviate downward pressure from the recent retracement.
Technical analyst Ali Charts shared on X that the Tom DeMark Sequential indicator has triggered a buy signal for XRP, suggesting a possible bounce from present price levels.
Crypto strategist Egrag Crypto outlined a macro-level construction employing various analytical tools — Fibonacci circles, Fibonacci channels, Fibonacci extensions, and a falling wedge configuration. His assessment indicates XRP is consolidating within a significant Fibonacci timing window.
Potential Scenarios If Support Collapses
Per Egrag’s analysis, a validated breakout from the wedge pattern necessitates recapturing the $1.66–$2.00 range initially. Following confirmation, he projects upside objectives at $8.48, $13.70, $18.06, and $27.68 aligned with various Fibonacci extension measurements. These projections remain contingent upon pattern confirmation.
In a failure scenario, Egrag identifies $1.21, $0.90, and $0.60 as lower support benchmarks.
On the bearish side, if XRP cannot defend $1.10, the subsequent major support resides near $1.080 — corresponding to the 76.4% Fibonacci retracement threshold. Penetration below $1.080 would expose $1.0650, then $1.050. Further deterioration could bring $1.020 and $1.00 into consideration.
Rejection around $1.25 might perpetuate the broader corrective phase, while a breach under $1.09 could potentially target the $0.90–$0.86 region.
XRP’s pivotal levels remain concentrated at $1.09, $1.25, and $1.30. Presently, the price hovers marginally above $1.10 support while the hourly trendline restricts upward attempts at $1.120.