
 Consolidates Near $85: Will the Month-Long Range Finally Break?")
TLDR
- Solana (SOL) remains confined within a narrow $77–$88 corridor for approximately four weeks without establishing a definitive trend
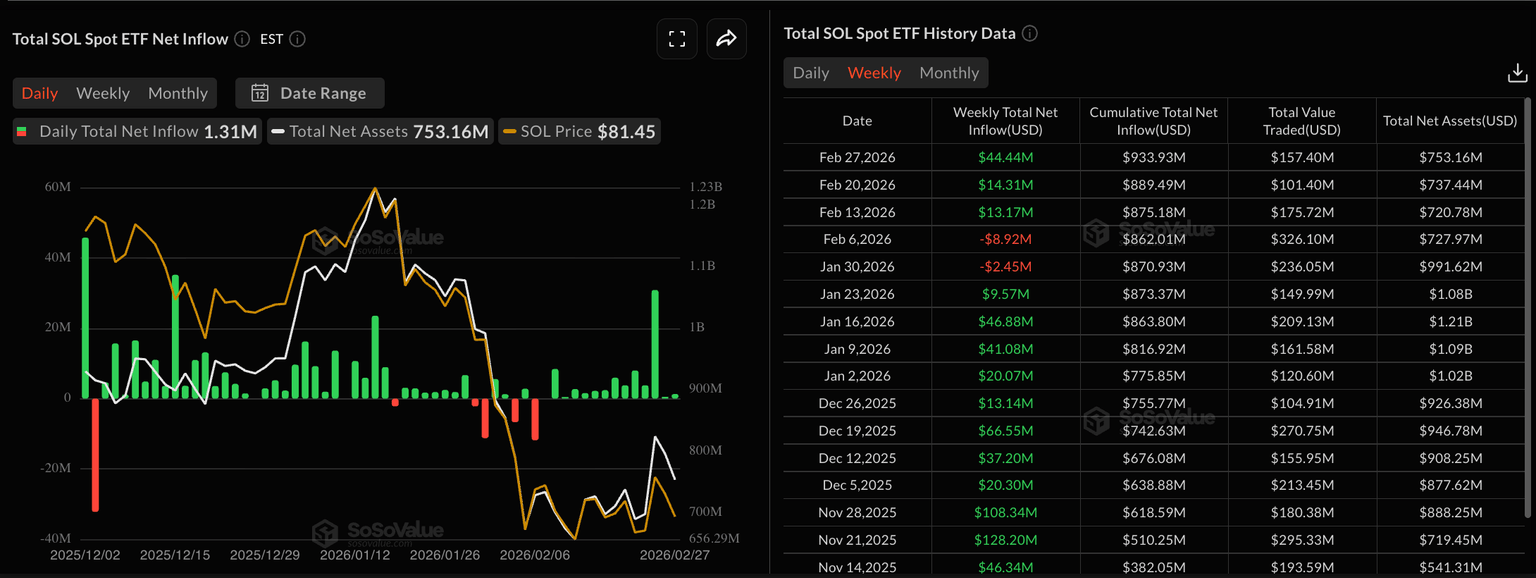
- Spot Solana ETFs in the United States attracted more than $44 million in weekly capital, pushing total inflows beyond $900 million
- Futures Open Interest for SOL declined by more than 6% within a 24-hour period, accompanied by $26.47 million in liquidations predominantly affecting long traders
- A Bollinger Band squeeze is developing, indicating an imminent volatility expansion that could move in either direction
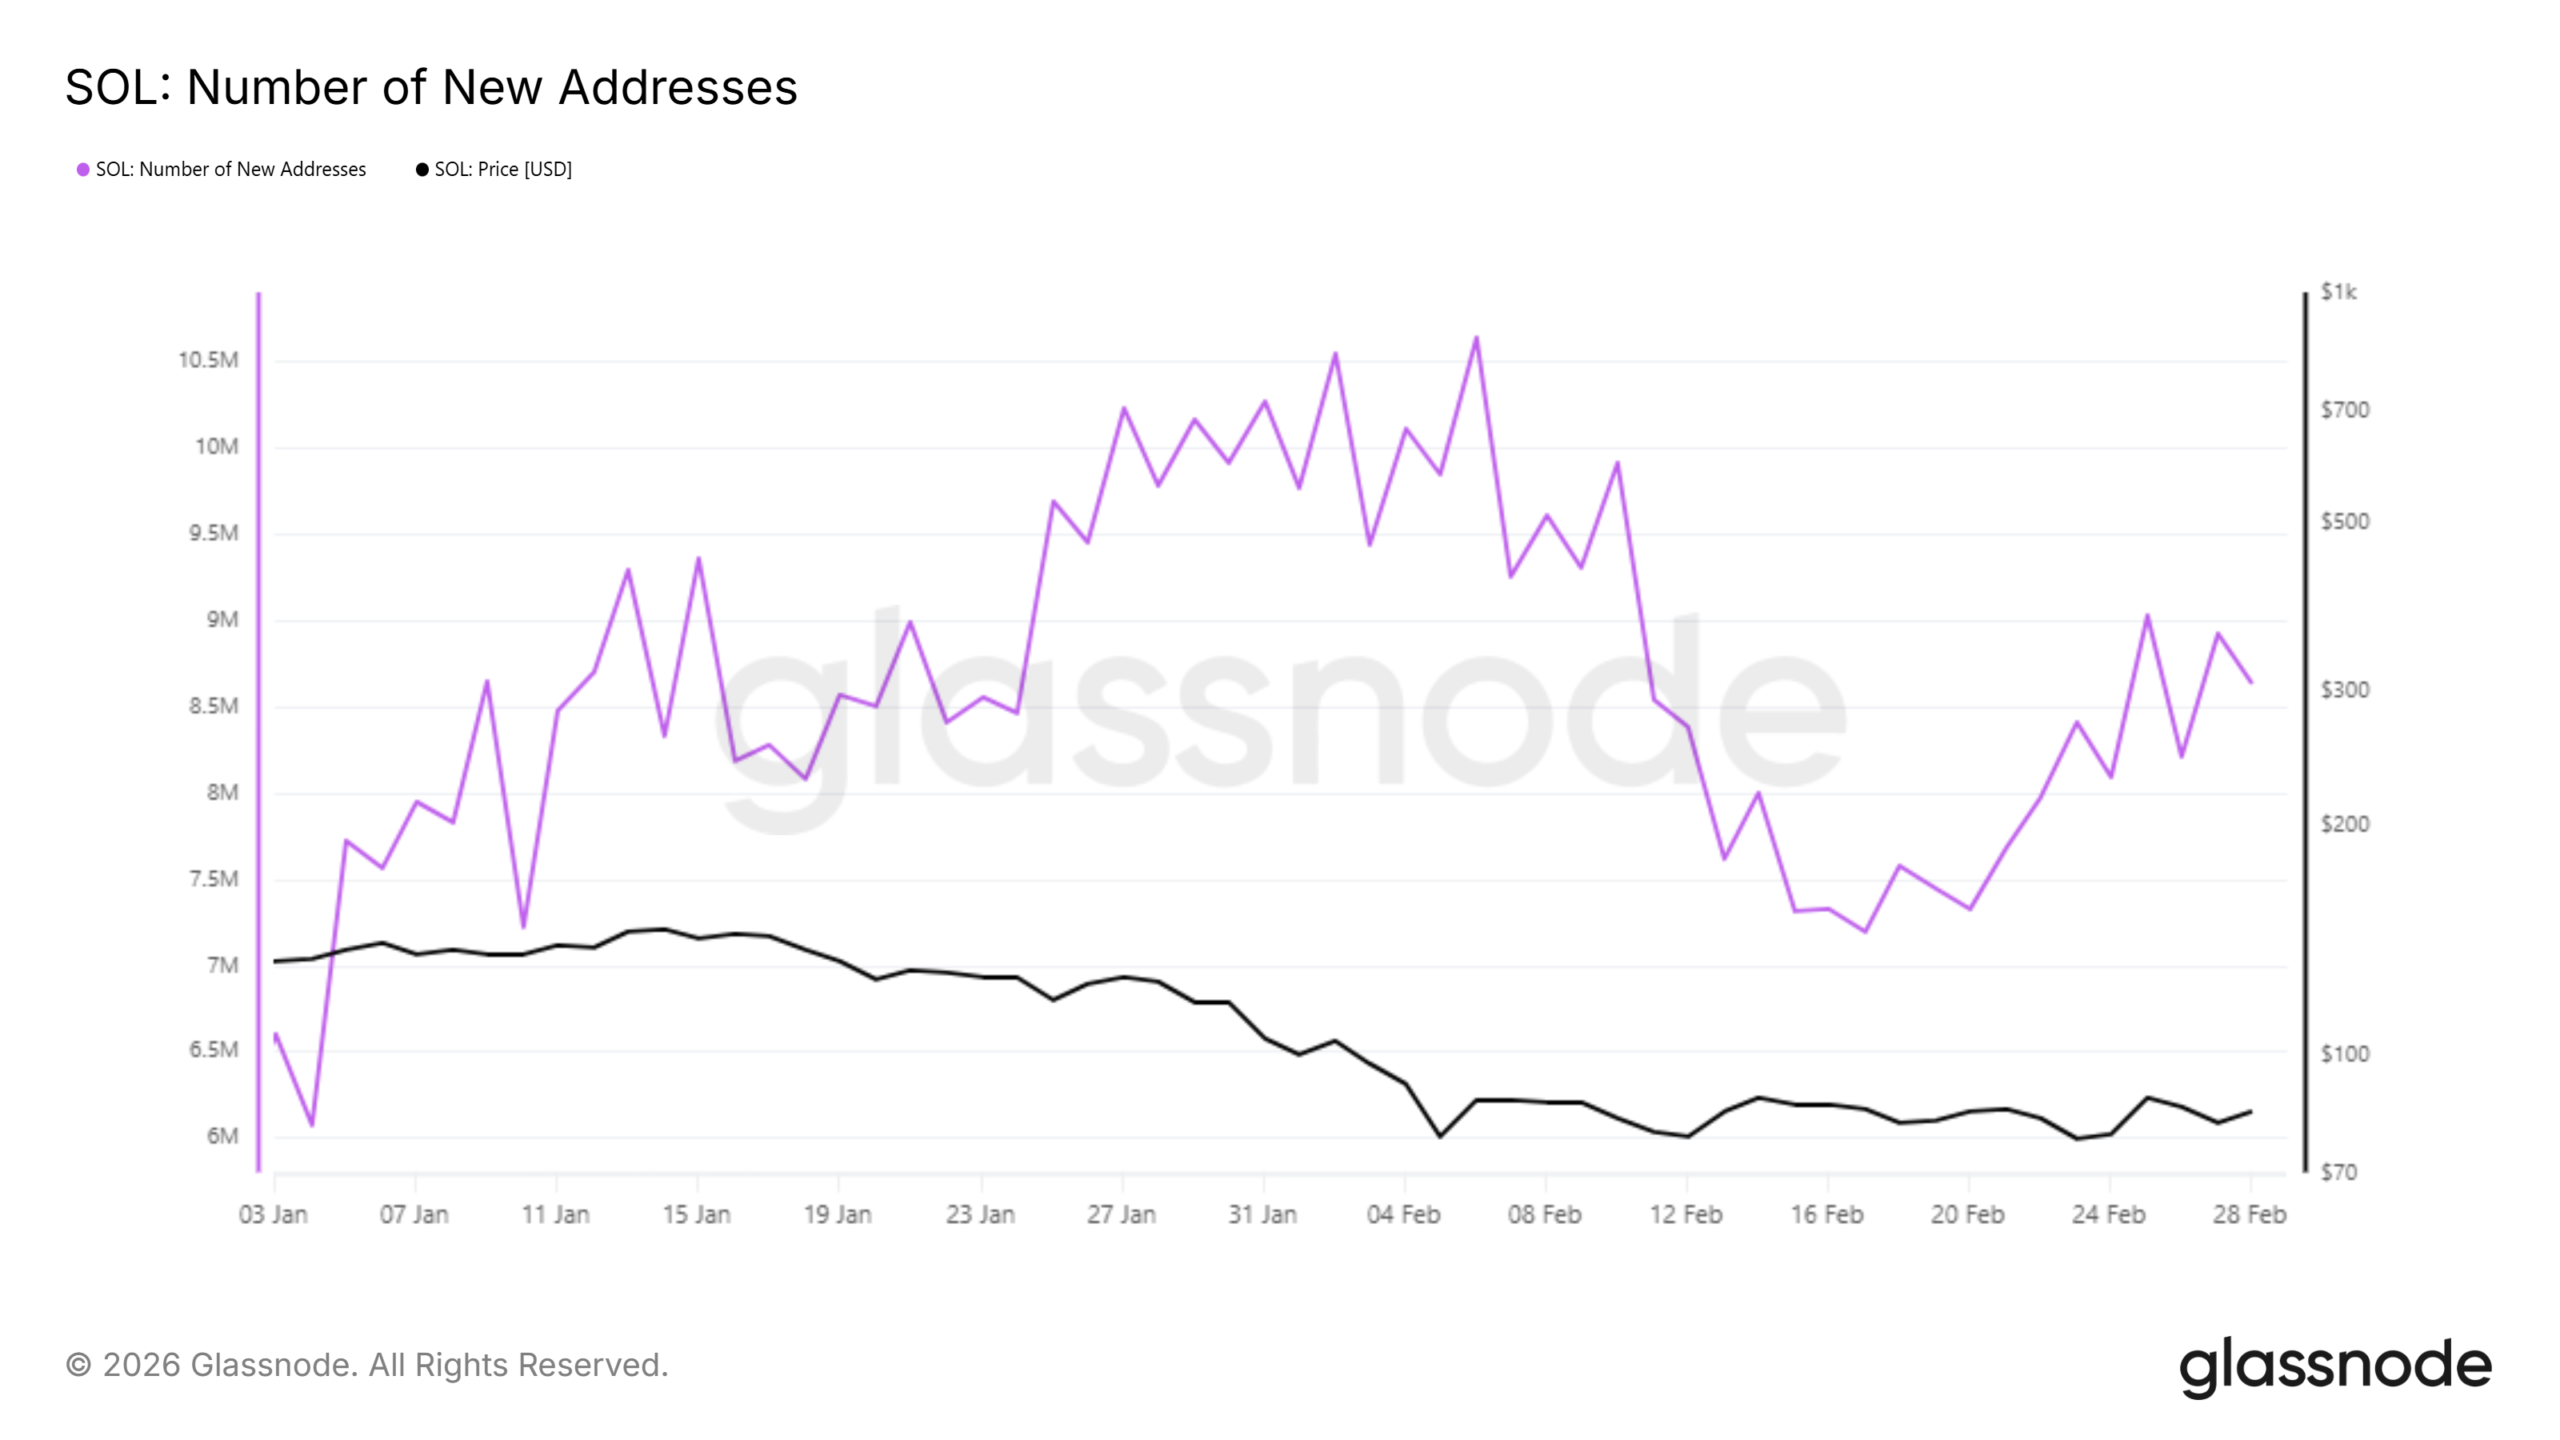
- New Solana wallet addresses increased by 1.4 million across 12 days, climbing to 8.6 million and demonstrating expanding network adoption
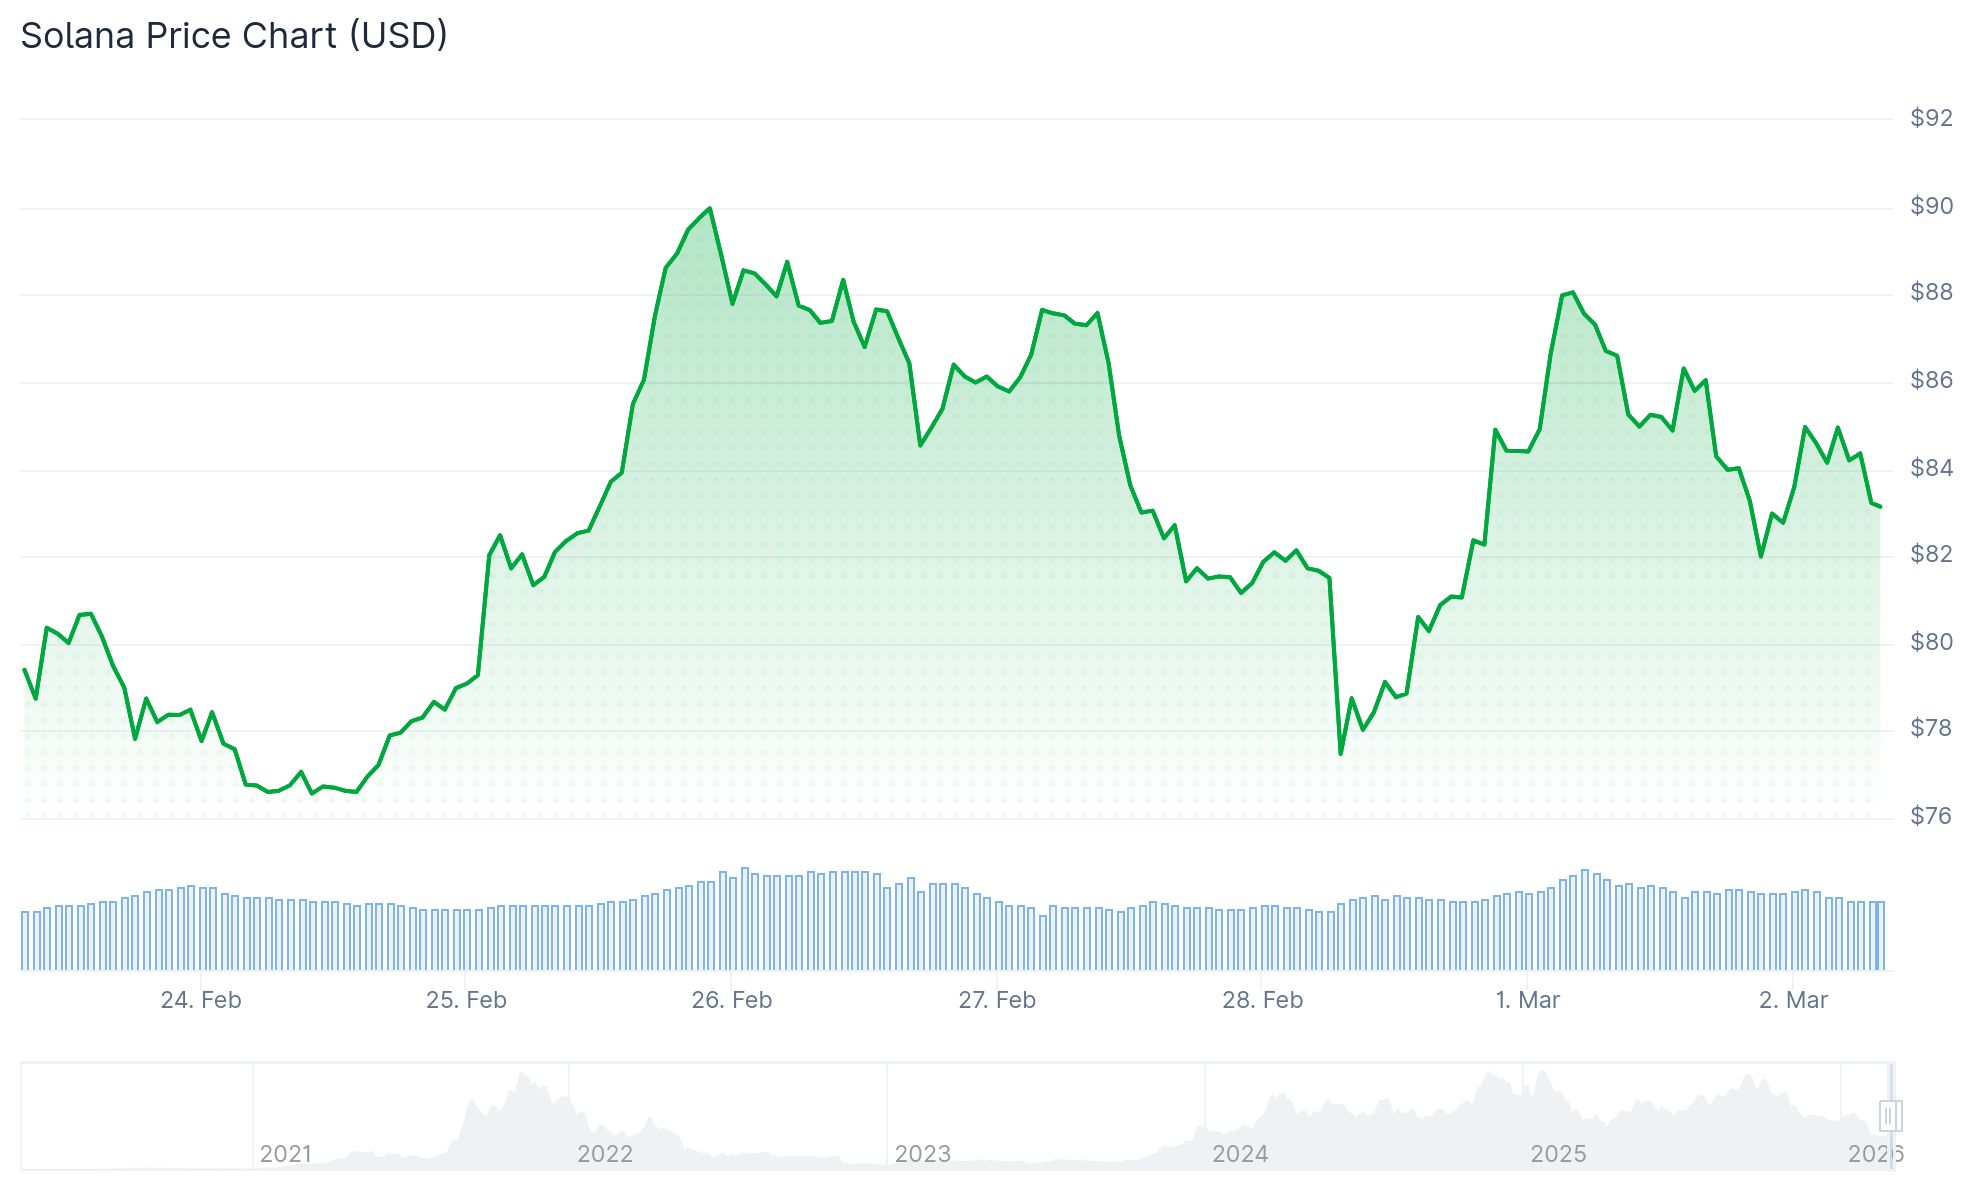
Solana (SOL) continues to hover between $84 and $85 as of March 2, 2026, maintaining a consolidation pattern that has persisted for approximately four weeks. The cryptocurrency has repeatedly tested the boundaries of a $77 to $88 range without achieving a conclusive breakout in either direction.
While price action remains subdued, institutional capital continues flowing into the asset. Spot Solana exchange-traded funds in the United States attracted $44.44 million in net inflows during the previous week, with Wednesday alone accounting for $30.86 million of that total.
Year-to-date cumulative inflows for these ETF products have now exceeded the $900 million threshold. Throughout February, the funds registered more than 12 consecutive trading sessions with positive net flows, even as comparable Bitcoin and Ethereum products experienced capital withdrawals during the same timeframe.
Retail trader activity presents a contrasting picture. Open Interest in SOL futures contracts dropped more than 6% over a 24-hour span to $4.89 billion, suggesting position closures among speculators.

Liquidations totaled $26.47 million during this period, with long positions accounting for $20.47 million of that figure. This indicates a substantial clearing of optimistic positions.
Despite these forced exits, the funding rate remains between 0.0037–0.0041%, indicating that leveraged traders continue paying a slight premium to maintain bullish exposure.
Key Technical Levels
SOL continues trading beneath both its 50-day and 200-day Exponential Moving Averages, presently positioned at $99.06 and $137.23 respectively. These moving averages represent significant resistance zones.
The Relative Strength Index registers approximately 43, sitting below the neutral threshold of 50. Meanwhile, the MACD histogram displays diminishing bearish pressure without yet producing a bullish signal crossover.
Bollinger Bands are compressing on the daily timeframe. This type of contraction typically precedes substantial price movement, although the eventual direction remains undetermined.
Trader Umair Crypto highlighted a divergence between SOL’s USDT and BTC pairs. While the USDT chart displays descending highs, the BTC pairing shows ascending highs — a discrepancy that has persisted for 24 days.
On-Chain Data Shows Network Growth
Blockchain analytics from Glassnode reveal that daily new Solana addresses expanded by 1.4 million during the preceding 12-day period, bringing the cumulative total to 8.6 million. This metric points to strengthening user adoption across the ecosystem.
Long-term token holders maintain profitable positions overall, though accumulation activity has moderated. Hodler net position change metrics demonstrate resilience while indicating decreased buying pressure.
Should SOL successfully breach $88 followed by $93.43, the subsequent target becomes the 50-day EMA around $99. A confirmed close above this level would establish a pathway toward $137.
Conversely, if the price falls below $77, support emerges at the February 6 low of $67.50.
SOL’s trading volume contracted 5.77% to $12.20 billion, while Open Interest similarly declined 3.73% to $4.88 billion according to the most recent data.