
 Slides 4% as $652M Floods Binance Amid Geopolitical Turmoil")
TLDR
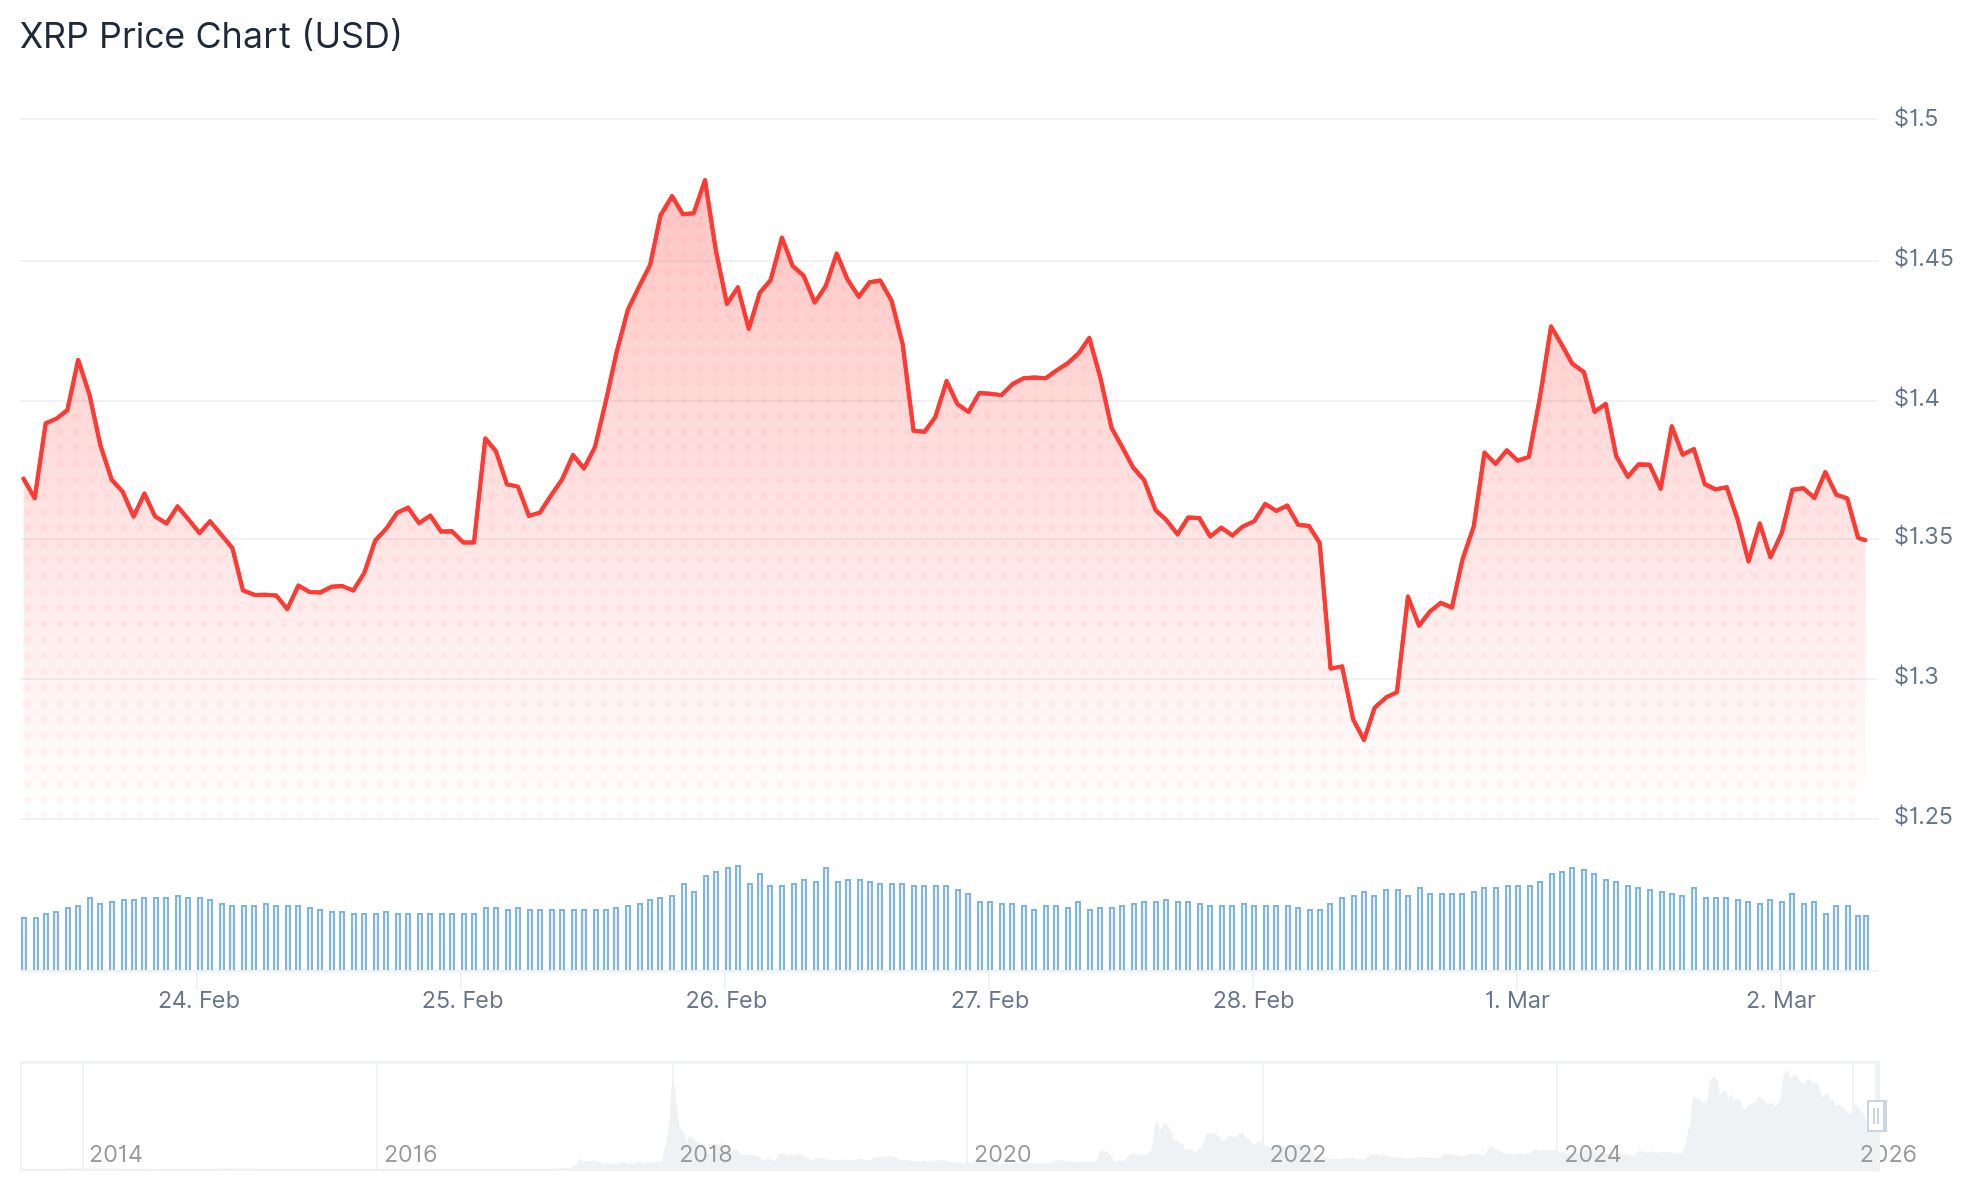
- XRP experienced a decline exceeding 4% over 24 hours, settling near $1.37 amid geopolitical uncertainty affecting digital asset markets
- Approximately 472 million XRP tokens (valued at ~$652 million) entered Binance exchanges during the past week, representing February’s highest inflow volume
- Iranian official Ali Larijani dismissed reports of diplomatic engagement with the United States, intensifying risk-averse market behavior
- Technical analysis reveals a bear pennant formation on XRP’s daily chart, suggesting a potential decline of 35% toward $0.86
- Critical resistance levels emerge at $1.40–$1.42; breaching support below $1.30 may trigger intensified selling activity
XRP witnessed a decline surpassing 4% during Monday’s 24-hour trading session, hovering near $1.37 as escalating geopolitical friction involving the United States, Israel, and Iran created turbulence across global risk assets.
Weekend reports indicating a coordinated US-Israel military action against Iran sparked widespread liquidation throughout cryptocurrency markets. The incident’s occurrence immediately following traditional market closures intensified the market response.
Iranian national security advisor Ali Larijani subsequently refuted claims suggesting Tehran had reached out to Washington via Omani intermediaries, explicitly stating “we will not negotiate with the United States.” This declaration introduced additional market uncertainty.
Precious metals like gold experienced upward momentum as investors sought refuge in traditional safe-haven assets, while cryptocurrency valuations declined in tandem with other speculative investments.
Blockchain analytics from CryptoQuant revealed that over 472 million XRP tokens, representing approximately $652 million in value, were transferred to Binance during the previous seven days. Market observer Darkfost characterized this as the “largest inflow period of the month of February.”
Substantial exchange inflows don’t necessarily indicate imminent selling pressure. Token transfers to exchanges may also represent liquidity optimization, collateral adjustments, or hedging strategies during periods of heightened volatility.

Nevertheless, Darkfost observed that substantial inflows “often signal a potential willingness to sell or at least to position liquidity closer to the market.”
Binance’s XRP holdings had been experiencing steady declines since October 2025. The recent week’s influx represents a slight reversal of this extended pattern.
Technical Picture
From a chart perspective, XRP is developing a bear pennant configuration on its daily timeframe. This technical formation generally appears following significant downward movement and typically resolves by continuing the established trend.
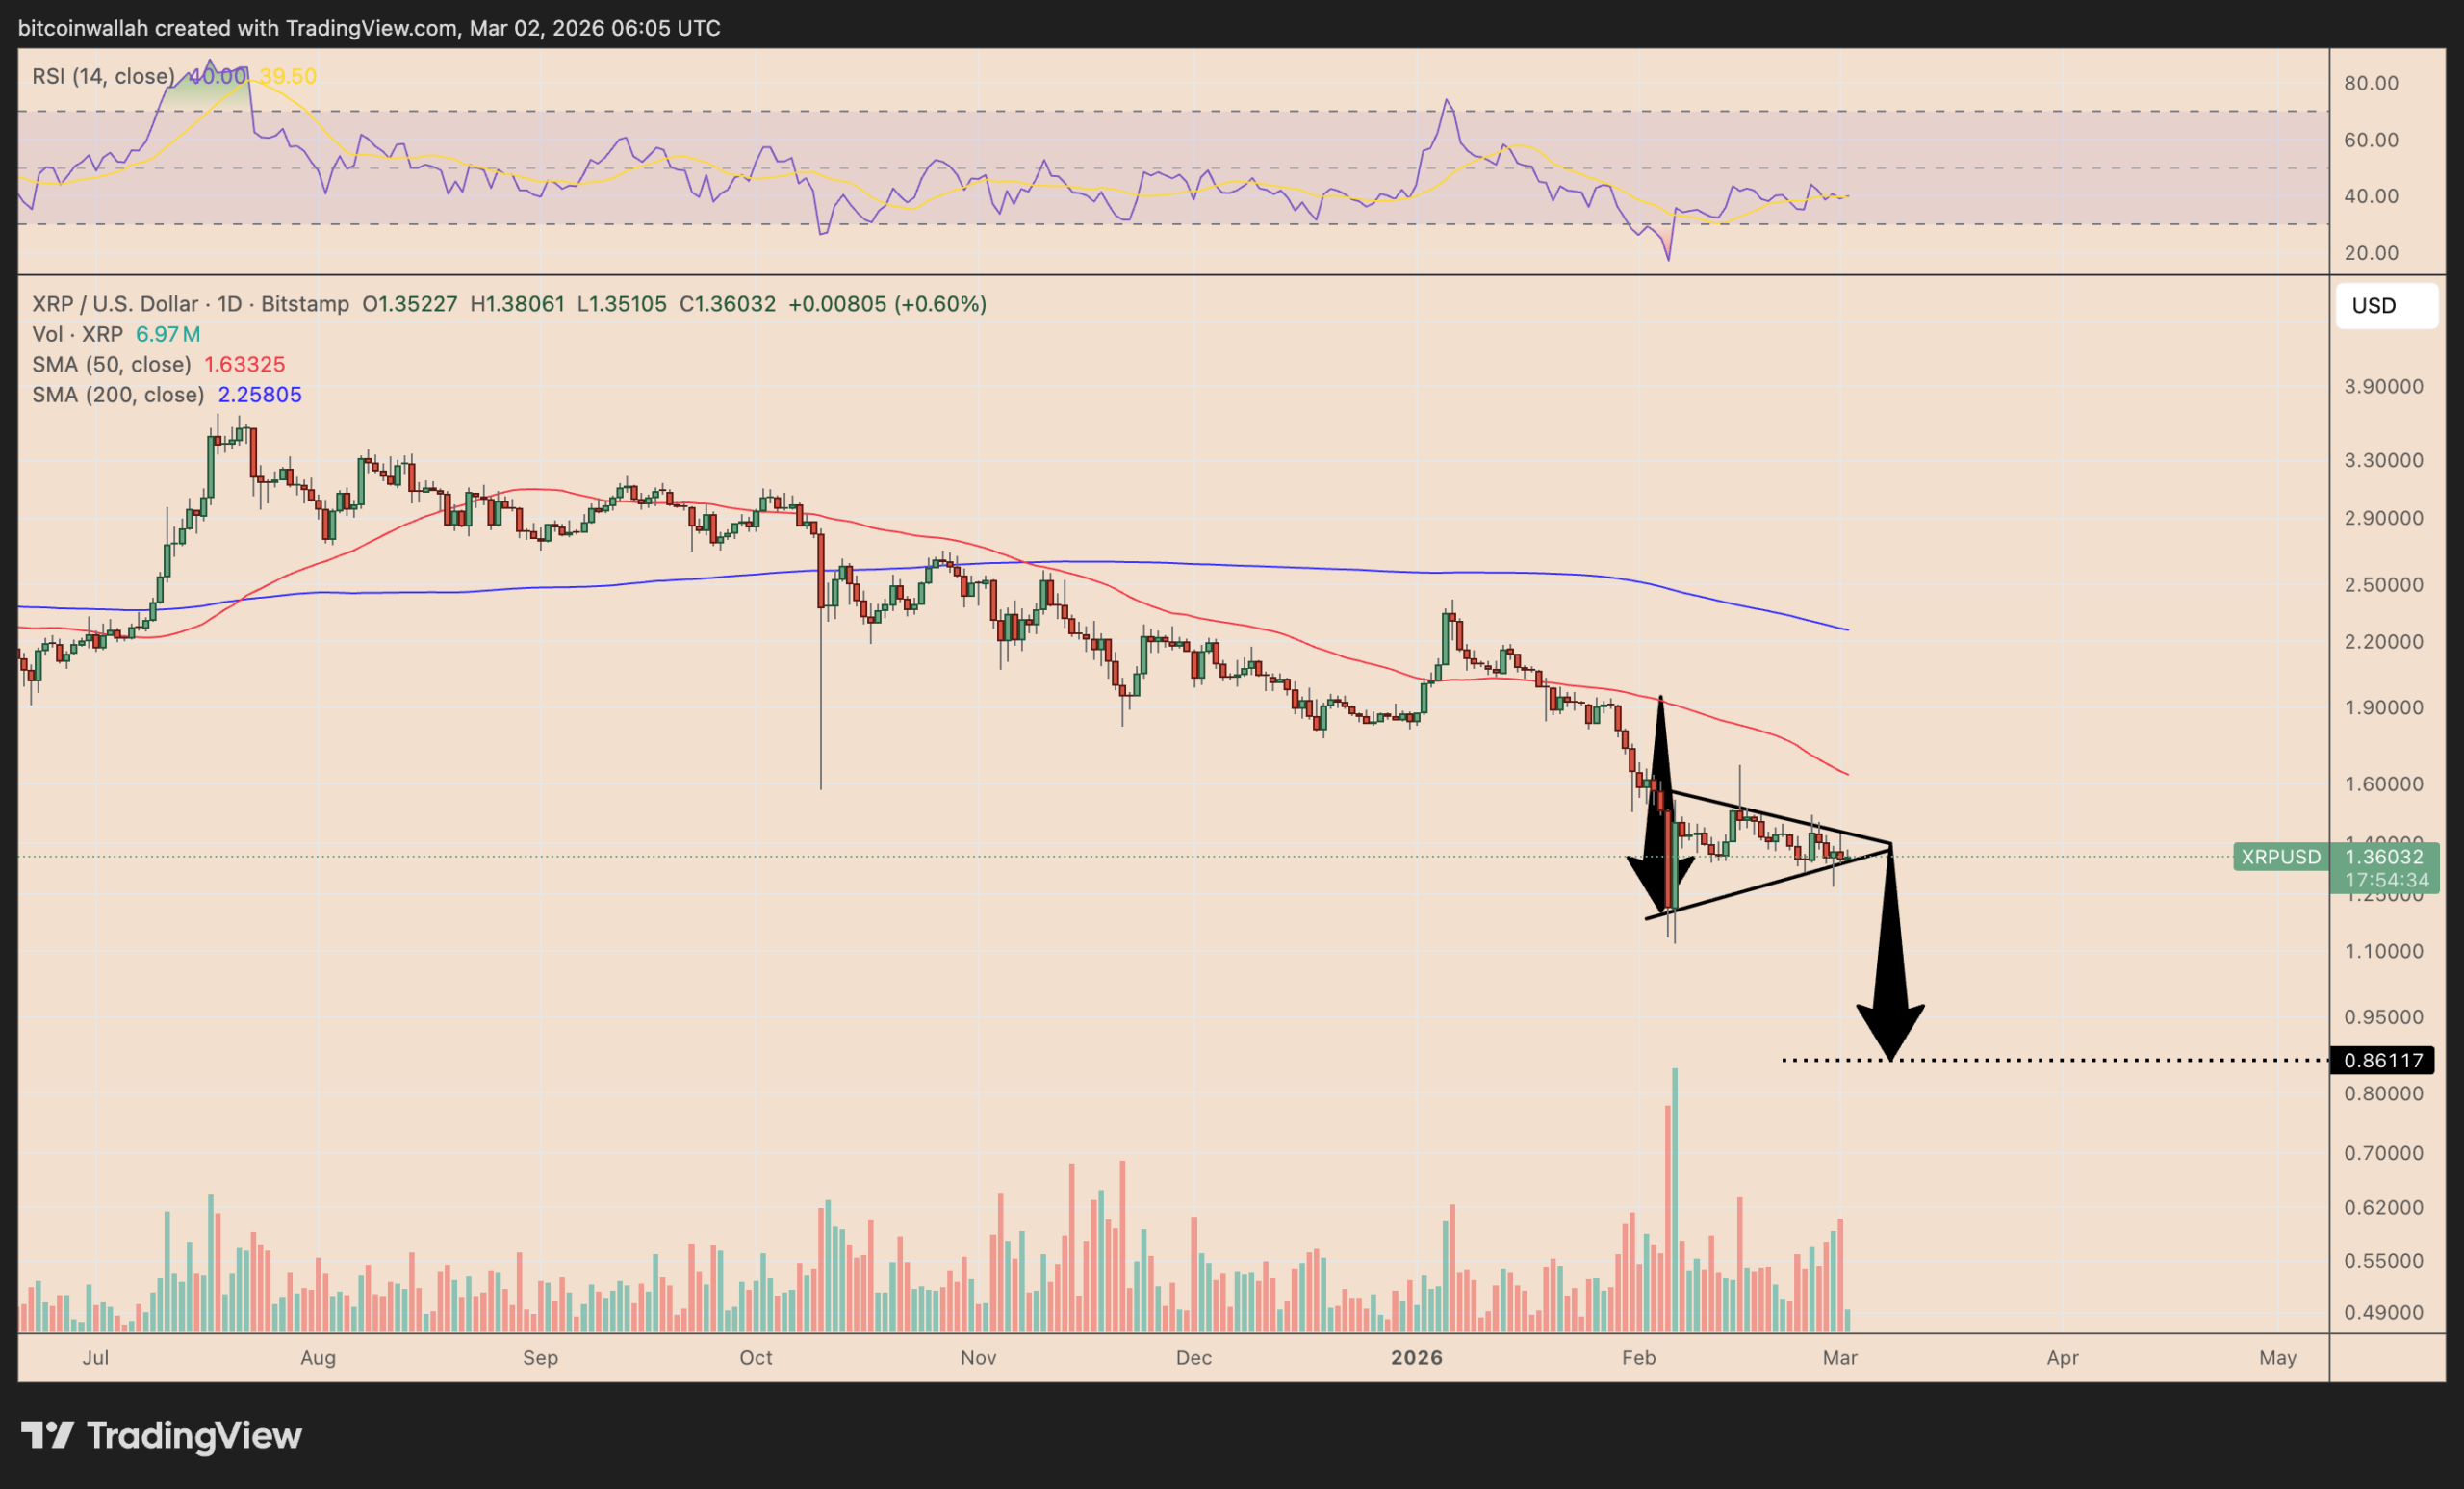
XRP has been trading within a compressed range characterized by descending peaks pressing against foundational support between $1.30–$1.35. Current pricing remains beneath both the 50-day simple moving average (~$1.63) and the 200-day simple moving average (~$2.26).
Should XRP breach the pennant’s lower trendline, the calculated target based on pattern measurements indicates approximately $0.86 — representing roughly a 35% decrease from present valuation.
Significant overhead resistance appears at $1.4080, corresponding to the 61.8% Fibonacci retracement level from the decline spanning $1.4936 to $1.2702. A decisive close above this threshold could potentially unlock movement toward $1.42 and subsequently $1.44.
On-Chain Signals
Glassnode’s MVRV Extreme Deviation Bands indicate XRP is gravitating back toward its aggregate cost-basis region. Should downward momentum persist, the next significant support level appears at the -$0.5σ band positioned near $1.00.
This establishes $1.00 as the primary downside objective, with $0.86 becoming relevant should a confirmed bear pennant breakdown materialize.
At press time, XRP was changing hands at $1.37 with exchange reserve levels increasing following the week’s substantial inflow activity.