
 Stock Slips Under $65 as Analyst Spots Buy Signal with $77 Target")
Key Takeaways
- SOL has fallen beneath the $65 threshold, positioned significantly below its 50-day, 100-day, and 200-day moving averages, confirming bearish momentum.
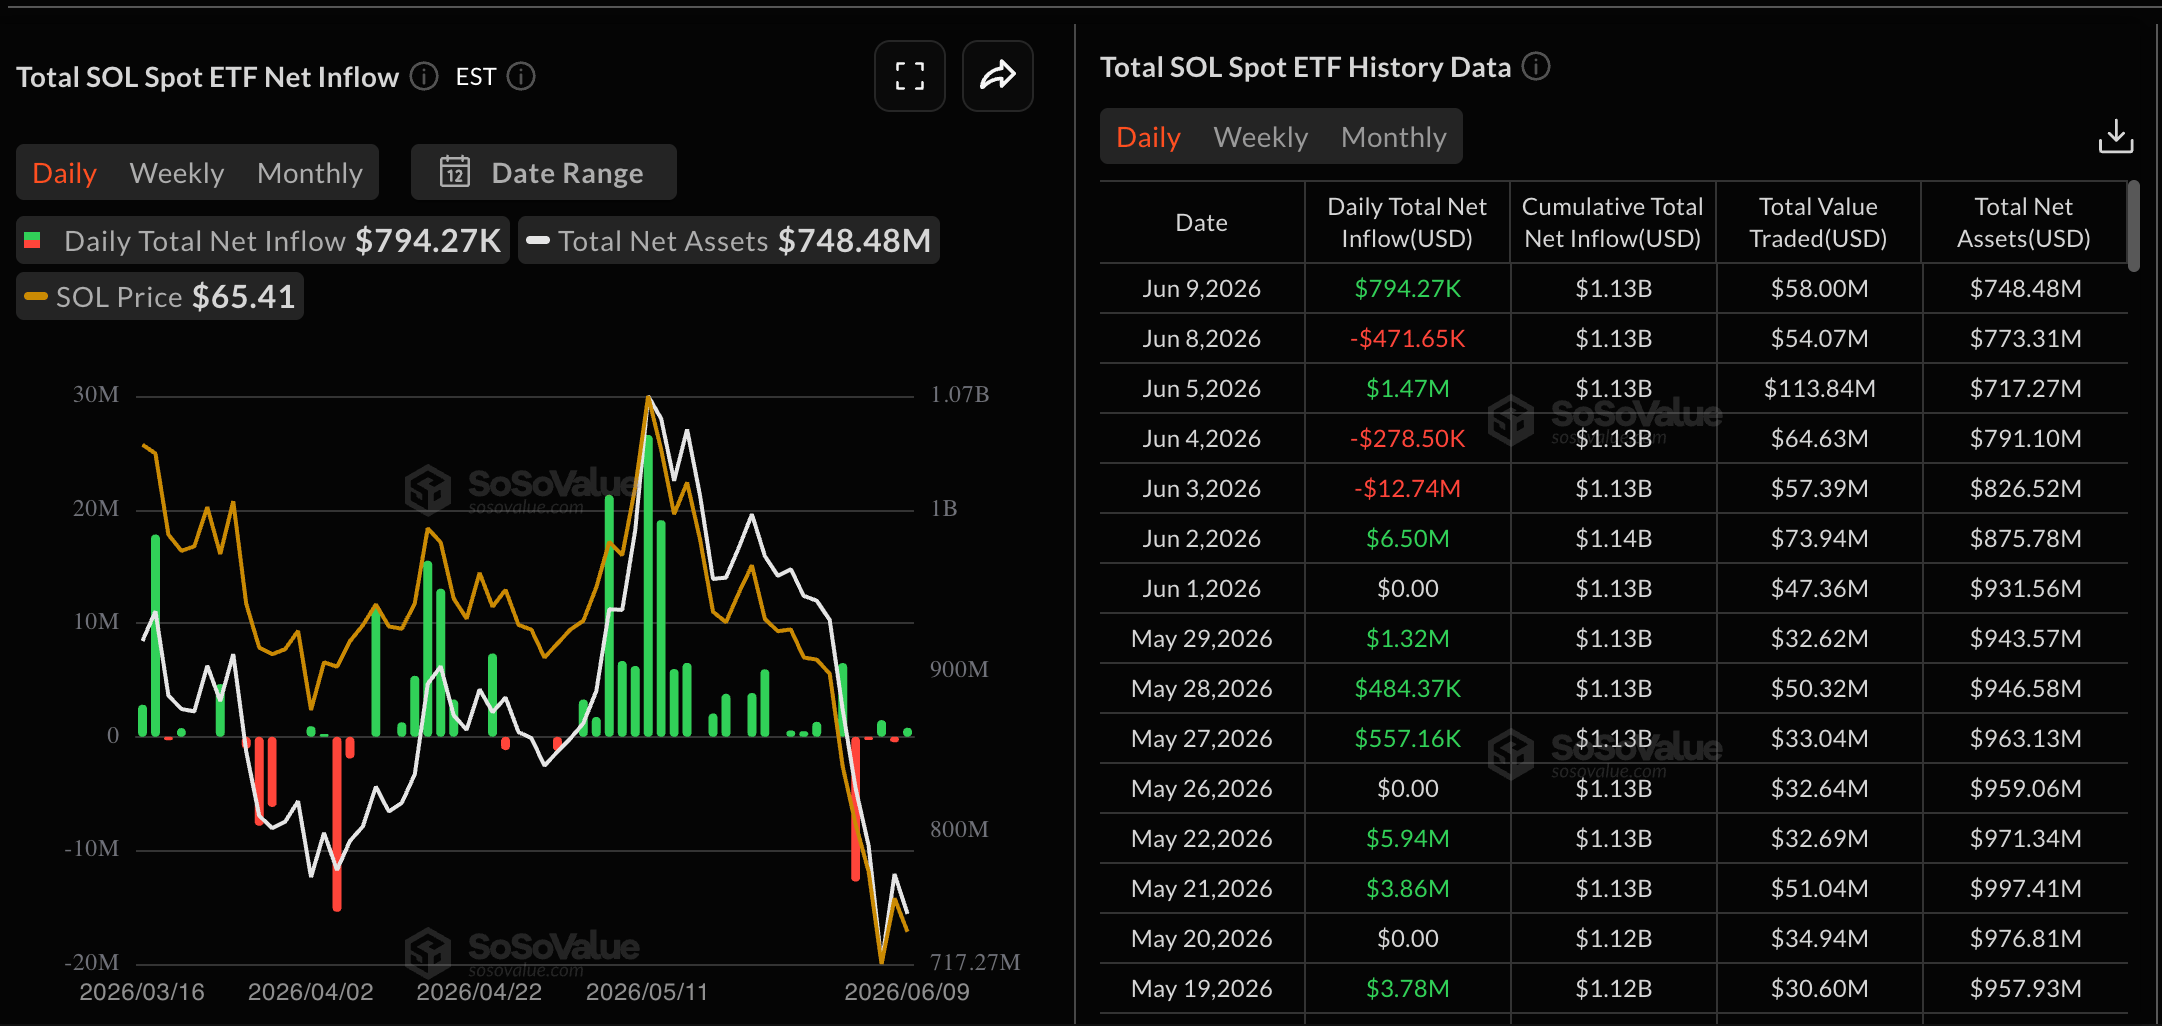
- Tuesday brought $794,270 in SOL ETF inflows, yet this follows a previous week that witnessed $6.52 million in outflows, revealing inconsistent institutional interest.
- SOL futures Open Interest has declined to approximately $4.41–$4.57 billion, a significant retreat from its earlier peak near $17 billion, indicating reduced leveraged positions.
- Exchange activity has shown improvement throughout March, with recent trading sessions displaying modest net inflows that hint at potential accumulation behavior.
- Technical analyst Ali Charts has identified a TD Sequential buy signal for SOL, suggesting a possible rally toward the $77 resistance zone.
Solana has faced persistent downward pressure across recent weeks, and Wednesday’s trading activity offered little reprieve from this trajectory. Currently trading within the $64–$66 range, SOL remains substantially disconnected from its critical moving averages, with multiple obstacles standing between current levels and meaningful recovery.
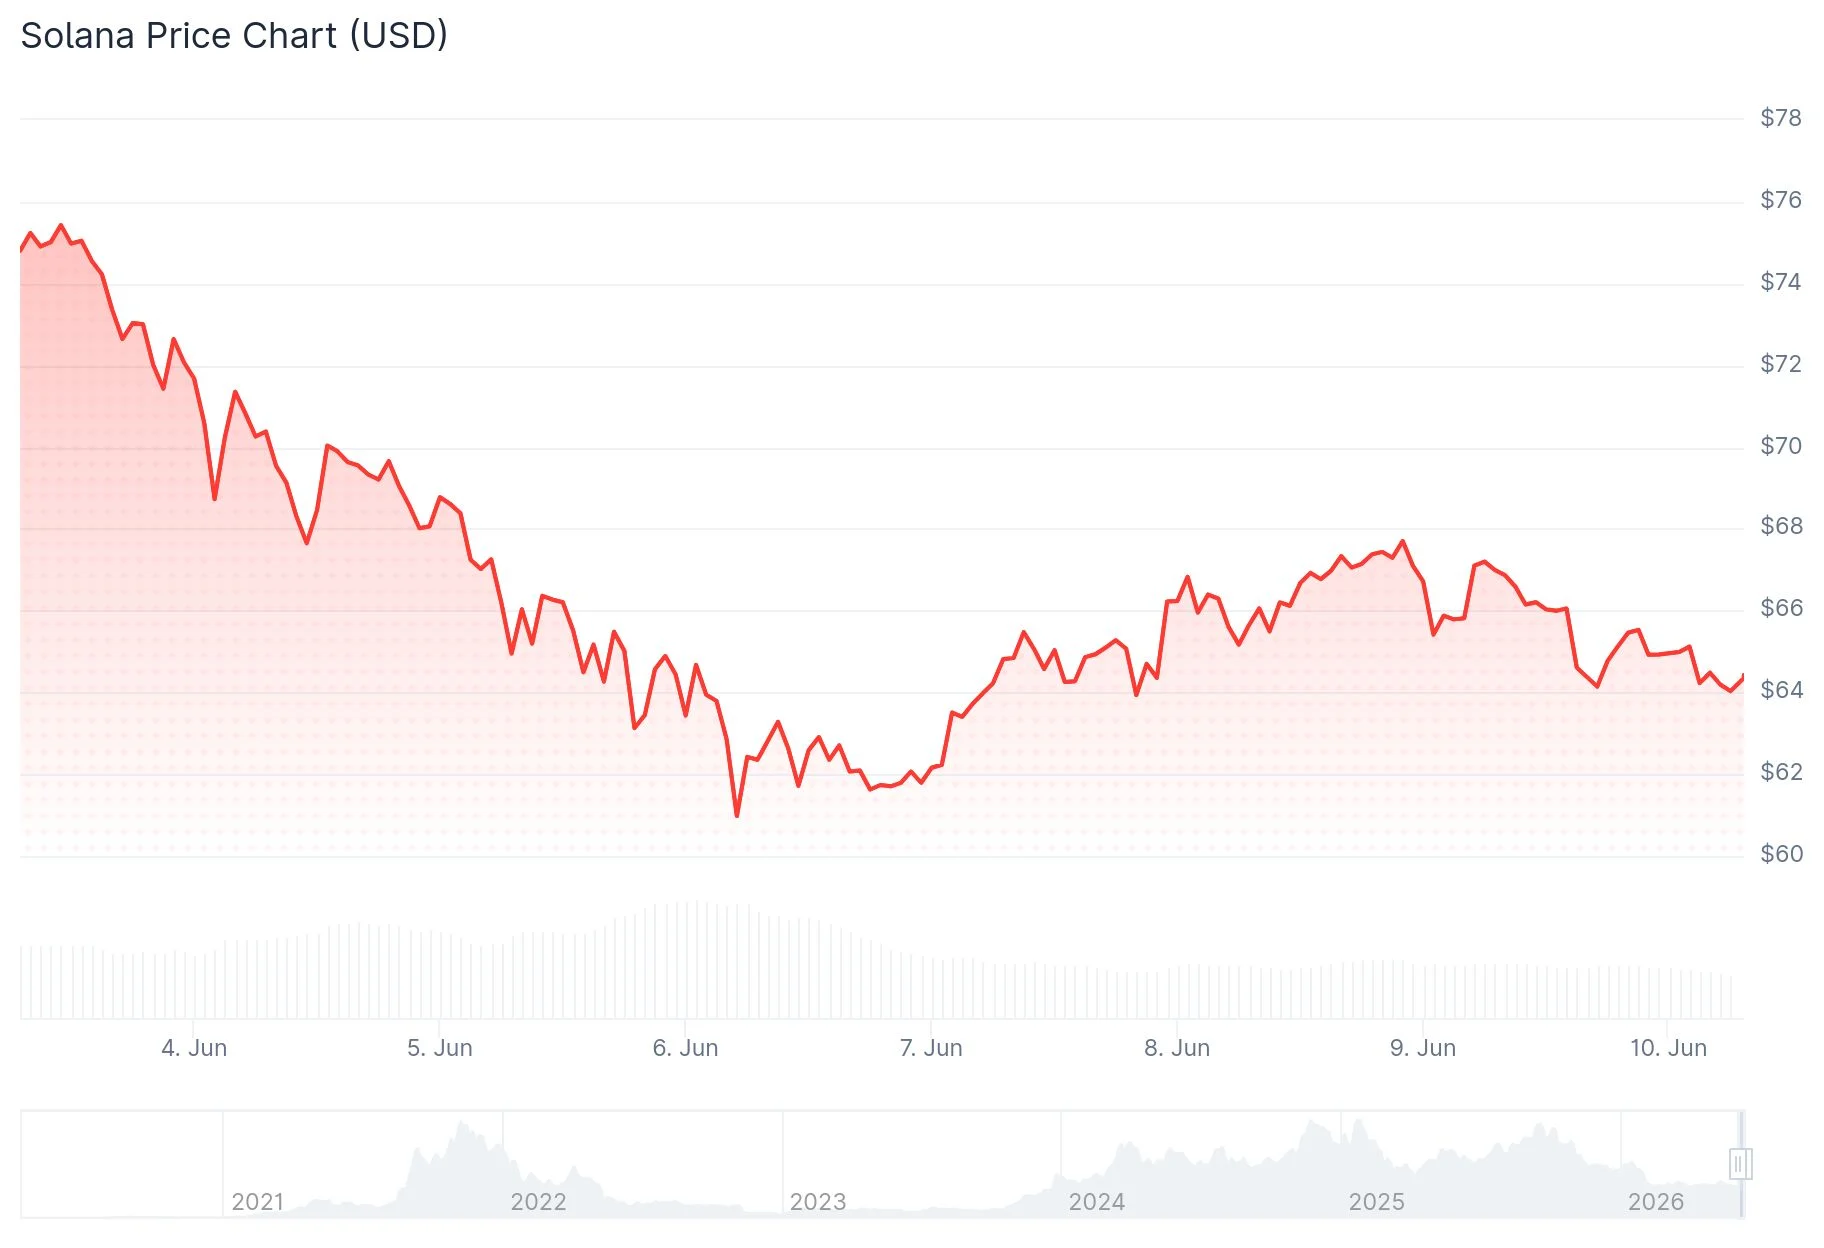
The digital asset rebounded from approximately $60.13 during Sunday’s session, managing a temporary uptick. However, this recovery momentum has since dissipated. The token continues trading beneath its 50-day EMA positioned at $80.25, its 100-day EMA at $87.22, and its 200-day EMA at $102.96. This configuration reinforces the prevailing bearish market structure.
Near-term support establishes itself at $65.59, coinciding with the 0.236 Fibonacci retracement marker. Should this level fail, a support band between $63 and $64 awaits, followed by the crucial swing bottom at $60.13–$60.17. A breakdown through this foundation would bring the $59.11 level into focus, a price point last visited in December 2023. Further deterioration could expose the $51.28 area, approaching the psychologically significant $50 threshold.
Institutional Investment Patterns Show Inconsistency
Examining the institutional landscape, SOL-dedicated exchange-traded funds attracted $794,270 in capital on Tuesday. This followed Monday’s $471,650 in redemptions. Taking a broader view reveals greater uncertainty — the preceding week experienced combined outflows totaling $6.52 million. Such volatility in weekly flows underscores wavering institutional commitment to the asset at present.

Retail trader engagement has likewise diminished. Funding rates, which registered negative territory at -0.0325% on Sunday, moderated to approximately -0.0042% by Wednesday, indicating reduced leverage-driven selling pressure. Nevertheless, Open Interest across SOL futures contracts declined roughly 2% over the past day to $4.41 billion. Long position liquidations comprised $8.29 million of the total $11.36 million in 24-hour forced closures, demonstrating continued fragility in bullish exposure.
Futures Market Shows Stabilization Within Constrained Range
Open Interest reached approximately $17 billion during Solana’s earlier rally phase this year. Following that peak’s dissolution, metrics have consolidated within a tighter corridor between roughly $4.5 billion and $6 billion. Current readings around $4.57 billion indicate traders maintain market presence without aggressively expanding leveraged positions.
Spot exchange data presents a comparatively optimistic outlook. Throughout March, deposit and withdrawal patterns have achieved better equilibrium, with several recent sessions registering moderate net deposits. This development suggests emerging accumulation patterns, despite the absence of a confirmed directional reversal.
Technical Indicator Suggests Potential Recovery Setup
Cryptocurrency technical analyst Ali Charts shared on X that a TD Sequential buy indication has materialized on the Solana chart. “Should this signal confirm, a movement toward the $77 resistance cluster represents the next probable destination,” the analyst noted. This projection aligns with broader technical frameworks — a sustained move above $67.50 could establish targets at $75.63, subsequently challenging the 50-day EMA vicinity around $80.25.
The Relative Strength Index presently reads approximately 26, firmly within oversold parameters. While this condition doesn’t guarantee an imminent reversal, it does indicate potential exhaustion in selling momentum.
On the resistance front, the $68.94–$69.48 zone represents the critical barrier that buyers must overcome to catalyze a meaningful shift in market psychology.