
 Stock: Critical Support Levels Under Threat as Price Tumbles Below $1,650")
Key Takeaways
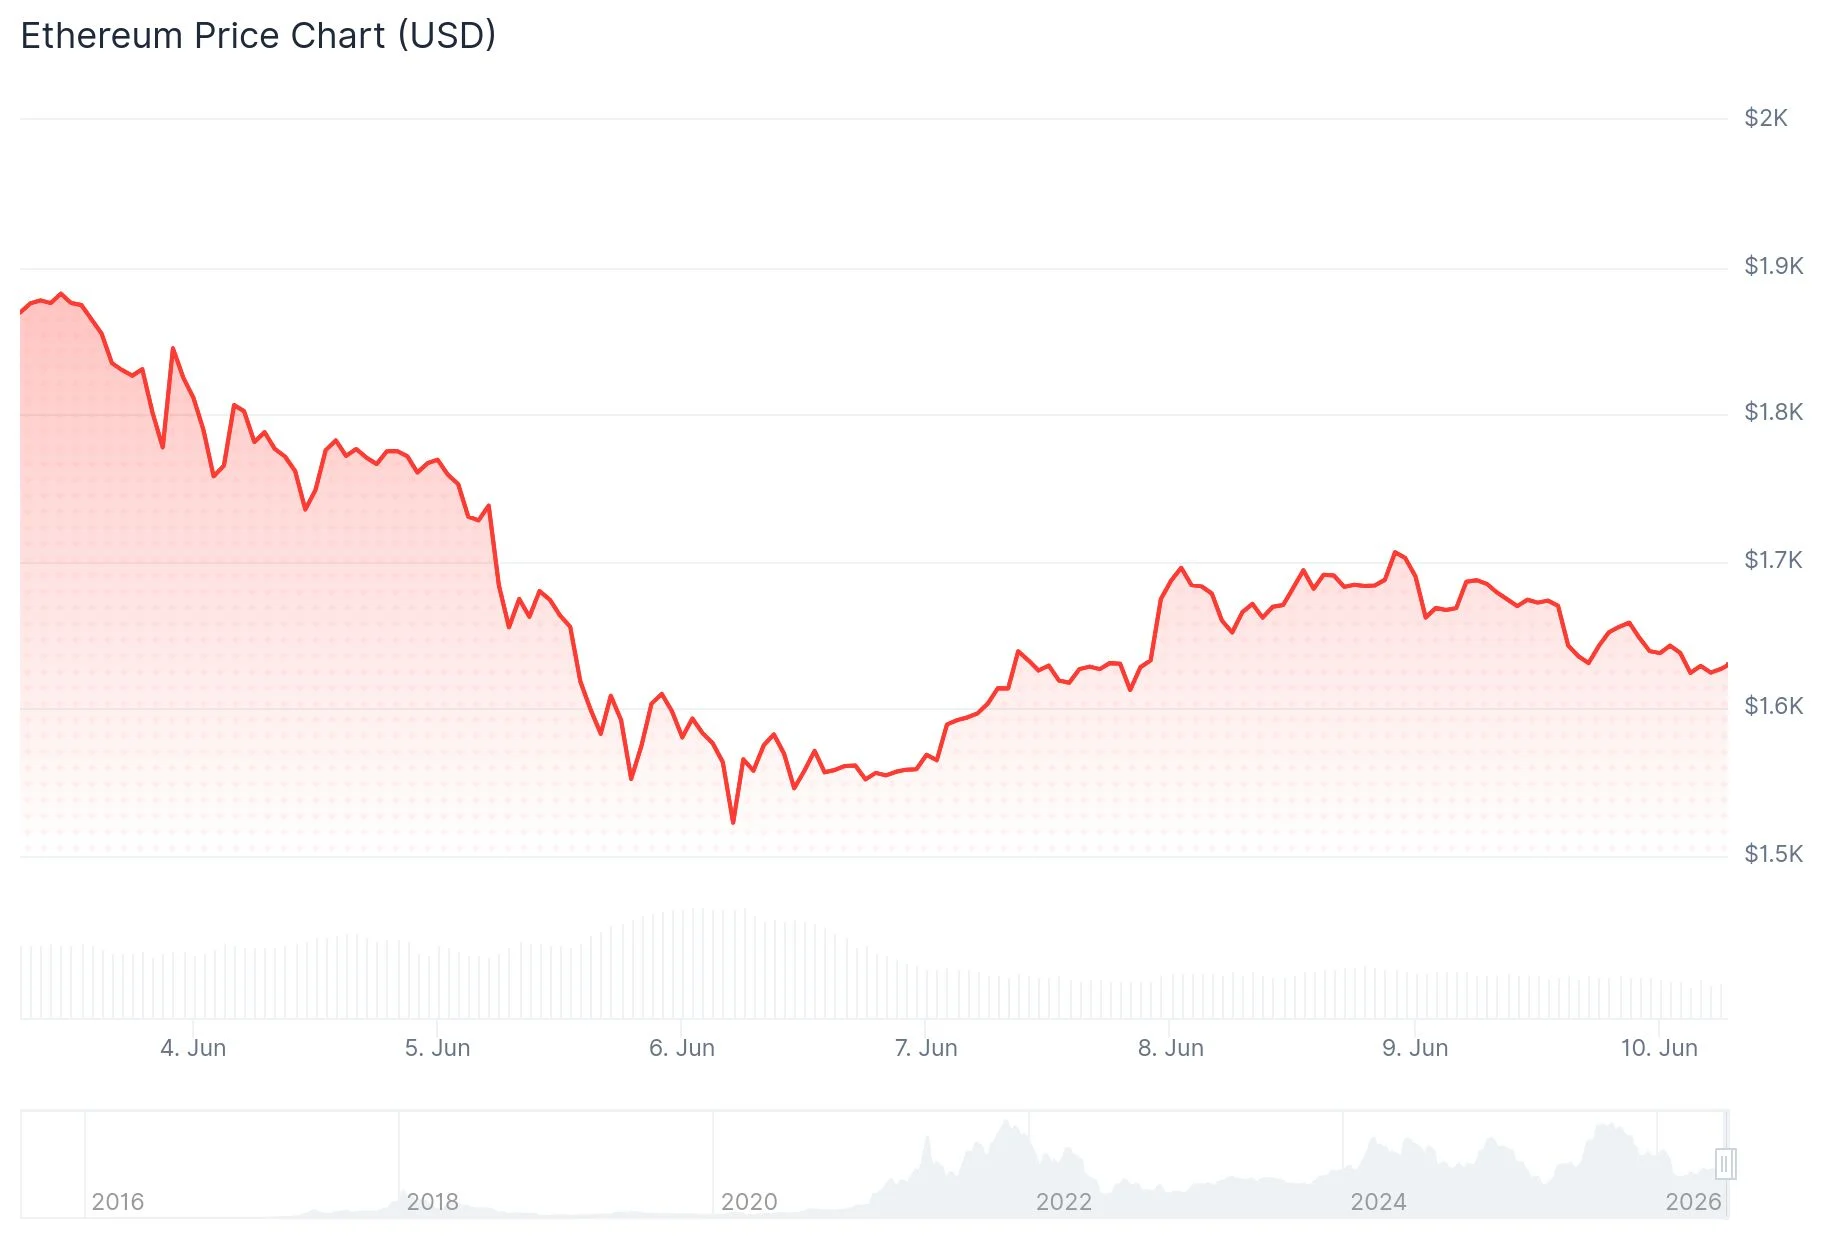
- Ethereum declined 4% over the past day, settling near $1,628
- The $1,700 zone has transitioned from support to resistance following February 2026 lows
- Cryptocurrency markets witnessed $1.1 billion in liquidations within a 24-hour period
- Exchange-traded fund flows revealed $91.37M in Bitcoin ETF outflows contrasted with $82.37M in Ethereum ETF inflows
- Breaking below $1,600 may trigger a move toward the $1,500 level
Ethereum is currently changing hands around $1,628 following a 4% decline over the last 24 hours. This downturn coincided with a broader cryptocurrency market correction of 3.46%, pushing the total digital asset market capitalization down to $2.12 trillion.
Bitcoin experienced similar selling pressure, retreating from $64,100 to approximately $61,049. The sharp market downturn resulted in more than $1.1 billion worth of liquidated positions throughout the cryptocurrency ecosystem within just one day.
Market analyst Ted (@TedPillows) highlighted that the $1,700 level is currently functioning as resistance for ETH. Notably, this price zone represented Ethereum’s bottom during February 2026, but market dynamics have shifted and sellers are now actively defending this threshold.
Ted cautioned on X: “$ETH is trying to reclaim the $1,700 level. This is the zone where Ethereum bottomed in Feb 2026 and is now acting as resistance. If ETH fails to reclaim this, a sweep of lows could happen next.” His technical analysis identified $1,540 as a possible bearish target.

The downward pressure wasn’t limited to major assets. XRP tumbled beneath $1.15, demonstrating that the selloff extended across multiple cryptocurrencies. Market participants attributed the weakness to deteriorating risk appetite and the unwinding of heavily leveraged trading positions.
Liquidation Metrics Suggest Continued Market Turbulence
Crypto analyst CryptoReviewing identified a notable asymmetry in the 24-hour liquidation distribution: $331 million in liquidated long positions compared to $1.84 billion in liquidated short positions. This 5.5x disparity suggests potential for rapid price swings should the market direction suddenly shift.
Bitcoin exchange-traded funds registered $91.37 million in net outflows on June 8, based on SoSoValue tracking. Meanwhile, Ethereum ETFs posted $82.37 million in net inflows during the same trading session, as reported by Wu Blockchain on X.
Examining the 4-hour timeframe, Ethereum was trading at $1,644 at press time. The Relative Strength Index hovers around 43.21, reflecting diminished momentum. The Chaikin Money Flow metric registers near 0.05, suggesting modest buying activity but lacking substantial conviction.
Critical Price Zones for ETH Traders
The initial resistance target stands at $1,700. A decisive breakout above this barrier would pave the way toward $1,800, a level that market observers believe could restore positive sentiment.
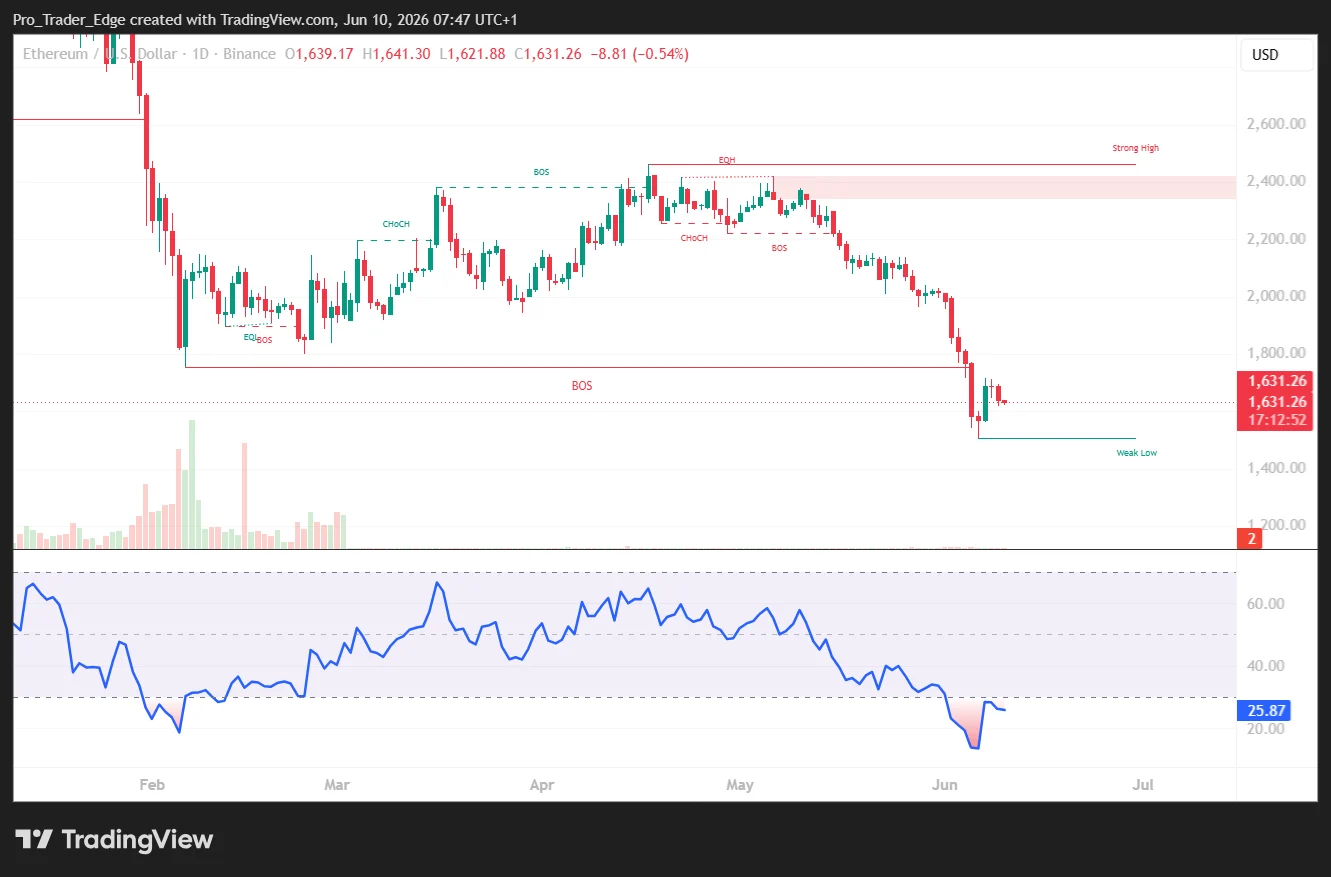
Successfully clearing $1,800 would potentially bring $2,000 into focus as the subsequent resistance area.
Regarding downside risk, $1,600 represents the critical support threshold. Should ETH breach this level, a pullback toward $1,500 becomes increasingly probable.
As of this writing, ETH maintains a precarious position slightly above $1,600 while technical momentum indicators continue to flash bearish signals.