
 Volatility Intensifies as Middle East Conflict Escalates")
Key Highlights
- BTC plunged to approximately $63,000 during the weekend following military operations against Iran, then bounced back toward $67,000
- Unverified claims about Iran’s Supreme Leader briefly lifted BTC past $68,000
- Oil prices jumped as much as 13%, increasing pressure on risk-sensitive assets like Bitcoin
- Critical U.S. employment and manufacturing data scheduled this week may trigger additional BTC price movement
- Technical analysts identify a bearish continuation pattern suggesting potential decline to $52,000 level
The leading digital currency experienced significant downward pressure throughout the weekend following coordinated military action by the United States and Israel against Iranian targets, sparking widespread risk-off sentiment in global financial markets.
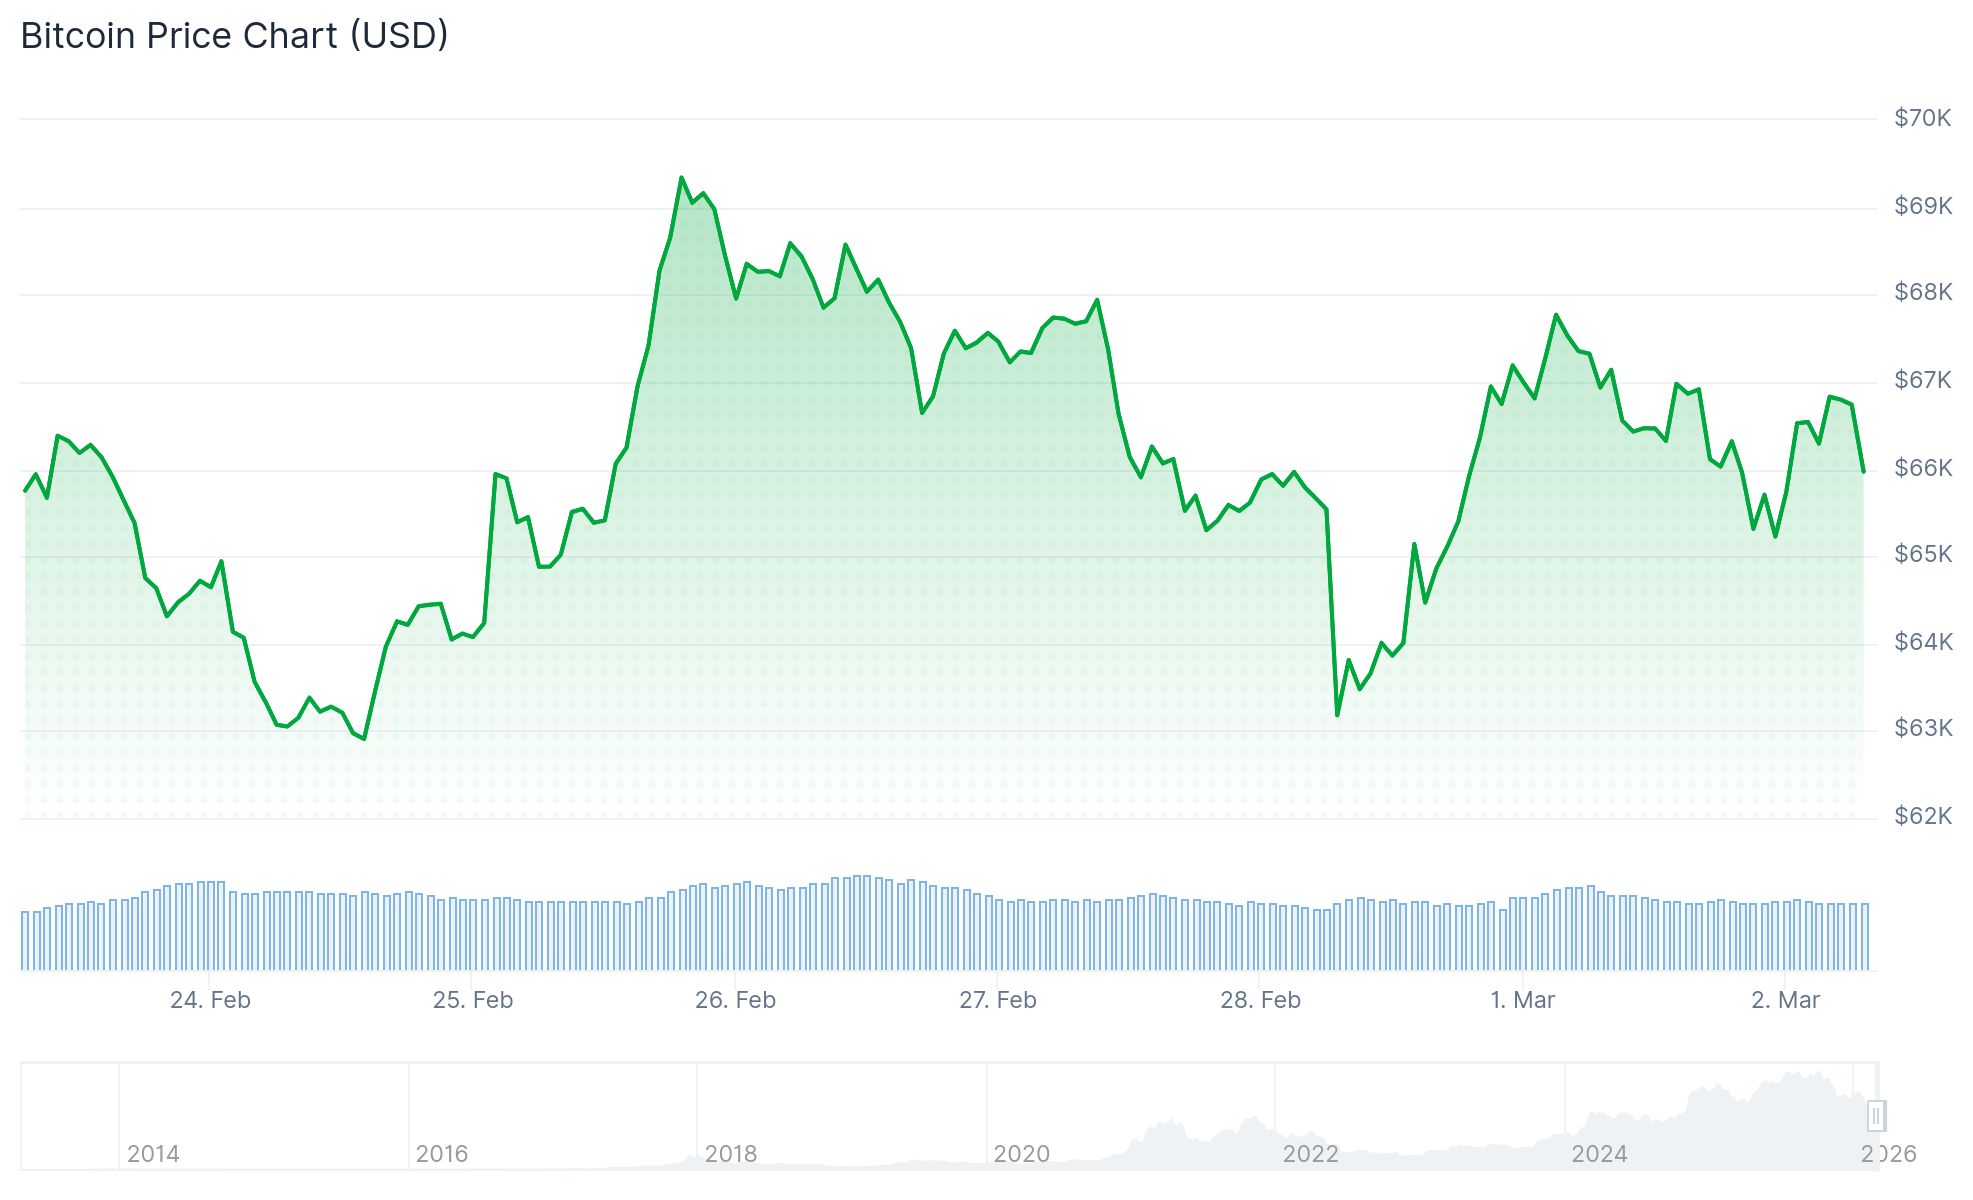
BTC tumbled to approximately $63,255 on Saturday, representing a decline of roughly 6.5% from prior levels, though it managed to stage a recovery back above the psychologically significant $67,000 threshold by Monday.
As Monday’s trading session commenced, BTC changed hands near $66,197, reflecting a 2.1% intraday loss.
The military campaign reportedly included an operation that allegedly resulted in the death of Iran’s Supreme Leader Ayatollah Ali Khamenei—unconfirmed reports that momentarily propelled Bitcoin beyond $68,000 before the rally lost momentum.

Tehran launched retaliatory missile barrages aimed at American and Israeli military facilities across the region. President Trump indicated the military operations would persist indefinitely.
Ethereum suffered an even steeper correction, declining approximately 10% following the attacks, with prices hovering around $1,950 on Sunday.
Energy Markets and Defensive Assets Rally
Crude oil markets demonstrated extreme sensitivity to the escalating conflict. Brent crude surged by up to 13% while West Texas Intermediate gained nearly 10% during Sunday evening trading.
Gold advanced roughly 2%, hitting multi-week peaks as market participants rotated capital into traditional safe-haven instruments.
Sean Farrell, Fundstrat’s head of digital assets strategy, noted that geopolitical-driven selloffs generally present buying opportunities, though he highlighted crude oil as a critical risk factor to monitor. He cautioned that any interruption to global shipping routes or energy supply chains could impose additional headwinds on Bitcoin.
U.S. equity index futures declined during Asian market hours, signaling potential weakness at the Wall Street opening bell.
Critical Economic Releases and Technical Levels in Focus
Market participants are closely monitoring a densely populated U.S. economic calendar. The ISM Manufacturing Index releases Monday, with ADP employment figures and ISM Services data following on Wednesday.
Friday’s Nonfarm Payrolls report represents the week’s marquee event, historically capable of influencing Treasury yields and dollar strength—both significant variables for Bitcoin price action.
From a technical perspective, BTC appears to be developing what chartists characterize as a bear pennant formation following its retreat from the $73,000–$74,000 region. This pattern implies the cryptocurrency may consolidate within a $63,000 to $69,000 trading corridor near-term.
A decisive break below this range could expose the $51,800–$52,000 support area, according to technical forecast models.
Bitcoin has declined 23% year-to-date and registered five consecutive monthly losses. The digital asset reached an all-time peak of $126,000 in October.
Several institutional analysts are now modeling scenarios where BTC tests the $50,000 level before establishing a foundation for potential recovery in the year’s latter half.
As of Monday’s latest pricing, BTC traded around $65,961.