
 Stock Hovers at $9 Support Level Amid Mastercard Integration and RWA Growth")
Key Takeaways
- LINK is currently priced between $9.02 and $9.10, experiencing approximately 7% decline over the past fortnight while gaining roughly 1.8% in the past day.
- The token is trading within a constrained corridor between $8 and $10, with market observers anticipating a potential surge to $11.
- Near-term chart patterns reflect bearish sentiment — LINK sits beneath its 20-day moving average with a downward MACD crossover signal.
- A strategic alliance with Mastercard enables more than 3.5 billion payment card users to purchase cryptocurrency directly on blockchain networks through conventional payment infrastructure.
- Technical analyst Ali Charts identified $10.10 and $11 as critical resistance zones if purchasing pressure materializes at present price levels.
The Chainlink protocol’s LINK token is navigating a compressed trading zone around $9, balanced between negative short-term chart indicators and expanding institutional adoption of its oracle technology.
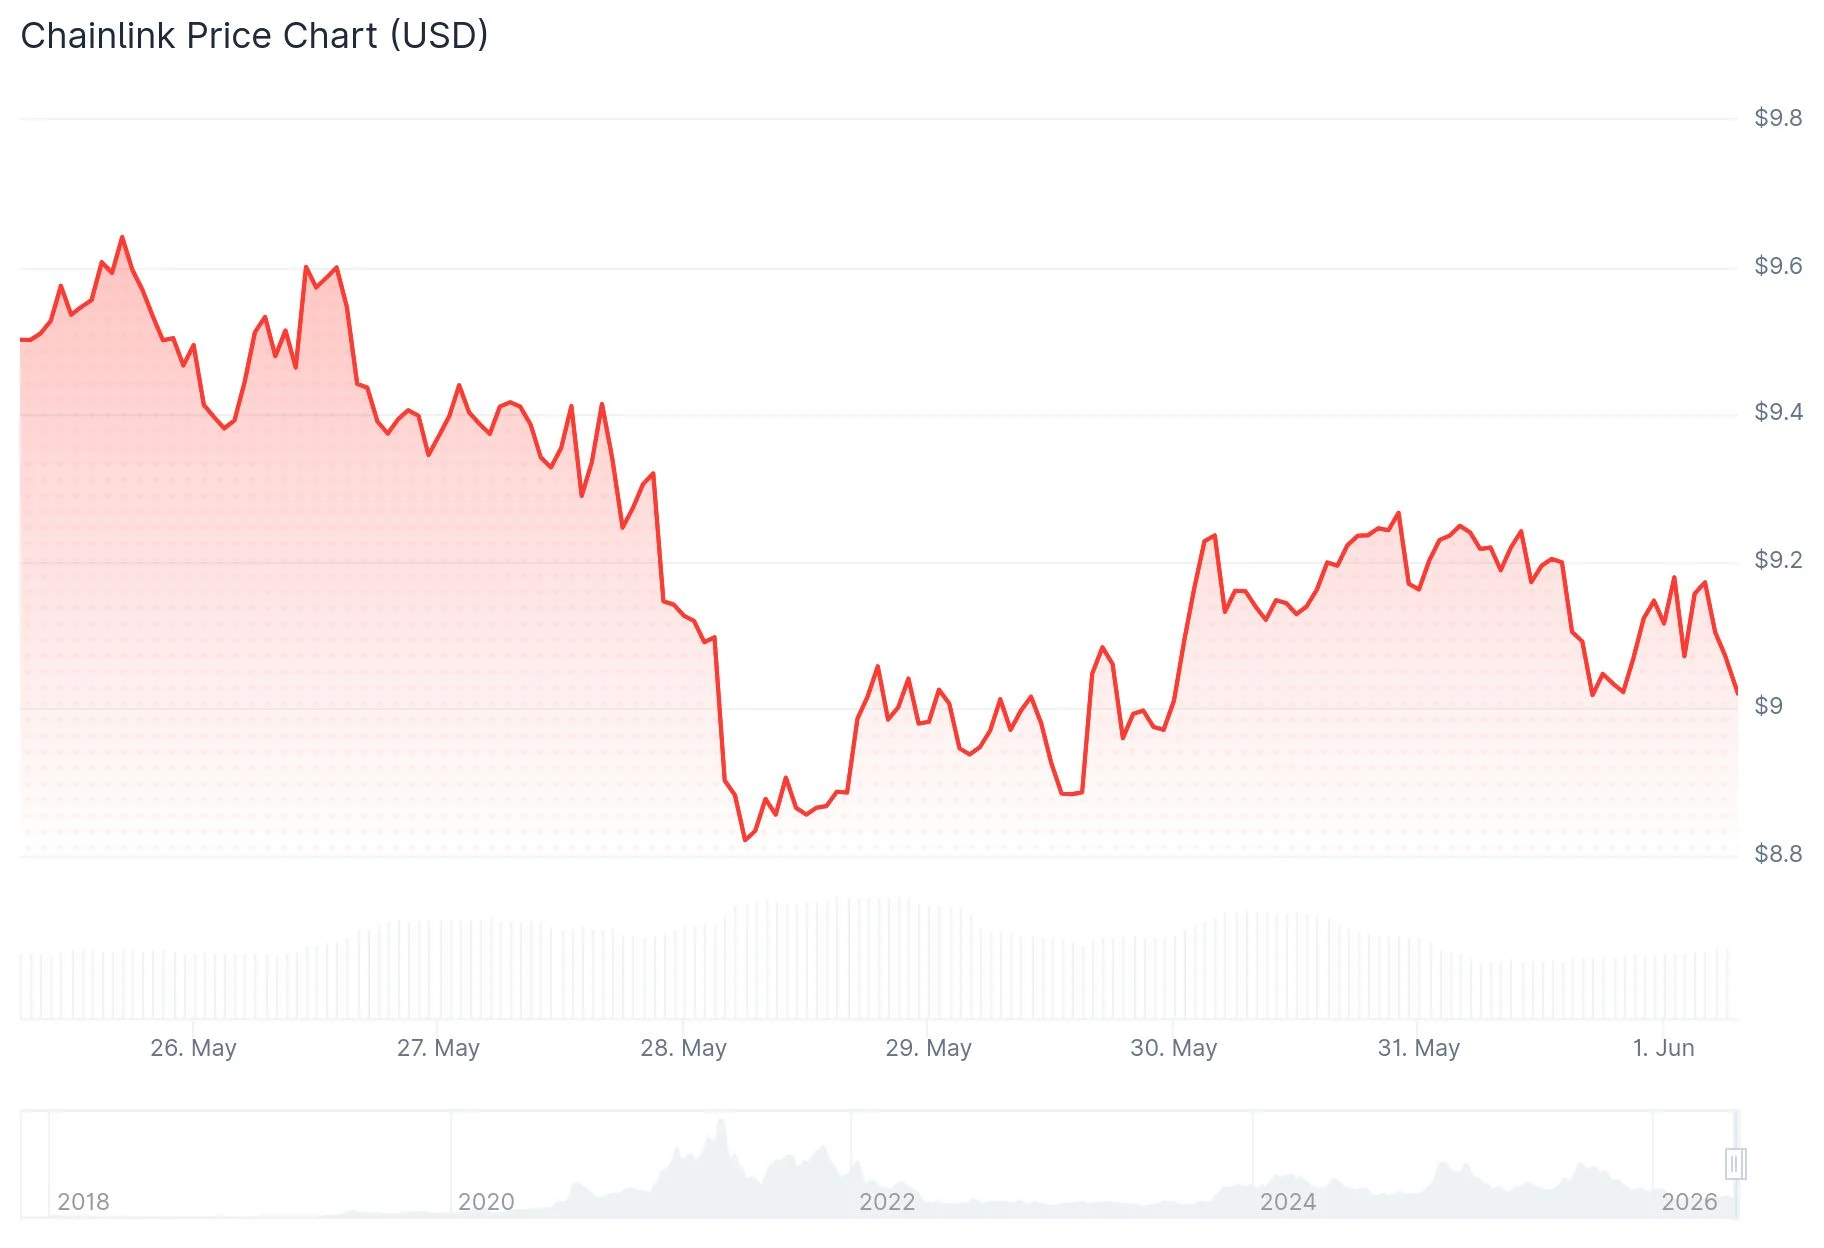
As of the latest market data, LINK was exchanging between approximately $9.02 and $9.10, registering daily transaction volume ranging from $289 million to $315 million alongside a total market valuation of $6.56 billion.
The digital asset recorded a moderate 1.8% advance during the most recent 24-hour trading window, though it continues to reflect nearly 7% erosion across the preceding two-week stretch, mirroring the wider cryptocurrency market’s subdued performance.
Cryptocurrency market analyst Ali Charts shared observations via X indicating that LINK is presently examining the floor of its established price corridor. According to his assessment, should buying momentum emerge, he anticipates $10.10 and $11 as subsequent upside objectives — resistance points that correspond with projections from additional market commentators.

The trading behavior has contracted into an increasingly narrow channel, which chart specialists characterize as consolidation. Market strategist World of Charts highlighted that such constrained price movement frequently precedes a substantial directional shift, although the eventual trajectory remains undetermined.
Near-Term Technical Outlook Suggests Downward Pressure
LINK is presently positioned beneath its 20-day simple moving average of $9.57 and is nearing the lower boundary of its Bollinger Band range. The MACD indicator has shifted below its signal line while remaining in negative territory — a configuration that conventionally signals dominant selling pressure in the immediate timeframe.
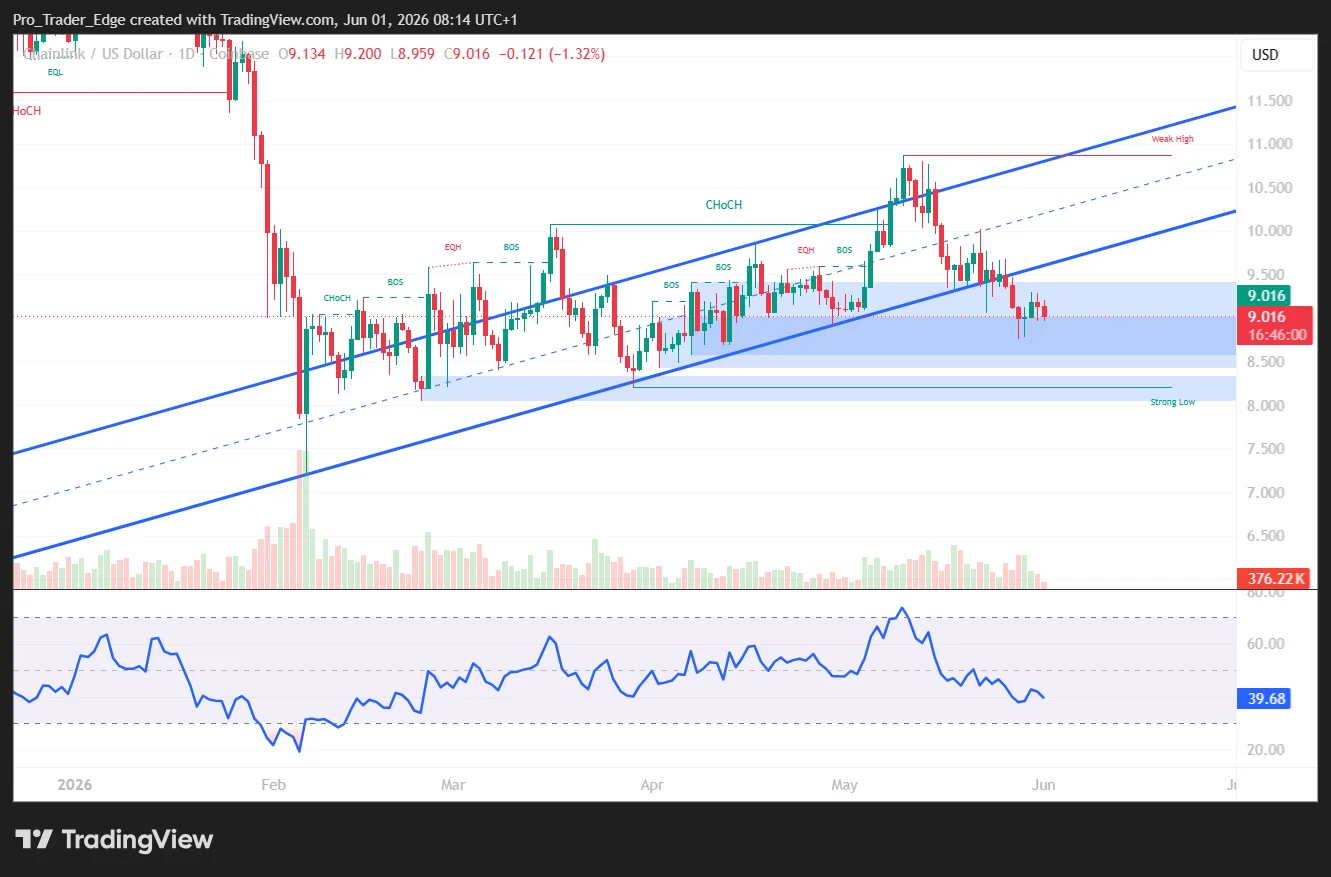
An earlier rally attempt targeting $11 during May encountered resistance, subsequently retreating to the current $9 territory. The $8 to $10 bracket has functioned as a consolidation area for multiple months following a correction from $14 downward to $7.30.
Should present support thresholds fail to maintain, market analysts have suggested additional consolidation phases or retesting of deeper support structures as probable scenarios.
Mastercard Collaboration Unlocks Access for Billions
From a fundamental perspective, Chainlink announced a strategic collaboration with Mastercard designed to enable over 3.5 billion Mastercard account holders to acquire cryptocurrency directly on blockchain networks utilizing their standard payment credentials.
This integration bridges Mastercard’s established payment infrastructure with Chainlink‘s oracle framework, eliminating traditional barriers between traditional currency systems and distributed ledger transactions.
Chainlink functions as the authenticated data conduit that validates real-world payment credentials and transmits this information to blockchain environments. This partnership is anticipated to streamline user onboarding procedures and approximate the crypto acquisition experience to conventional card-based purchases.
Chainlink’s fundamental value offering revolves around delivering authenticated external data to decentralized applications. Demand for this infrastructure is accelerating, especially within real-world asset tokenization initiatives — where financial entities require dependable data channels for activities including treasury operations and investment fund digitization.
The $10 threshold remains the primary near-term objective for bullish traders, with $11 representing the subsequent milestone should positive momentum resurface.