



Key Highlights
- XRP touched a critical support zone at $1.2710 on May 28, marking its lowest level since February.
- Technical analysts are spotting a triple-bottom formation alongside a hammer candlestick pattern, both typically considered bullish reversal indicators.
- Spot XRP ETFs have drawn $118 million in May, significantly outperforming comparable Bitcoin and Ethereum products.
- Technical analyst ChartNerd cautioned that losing the $1.28–$1.24 support zone could trigger a move toward $1.00.
- The RLUSD stablecoin has expanded to a $1.8 billion market cap, with trading volume surging 61% from the previous month.
Ripple’s XRP token experienced a significant downturn this week, testing a crucial support threshold that has proven resilient throughout 2025. The digital asset reached $1.2710 on May 28, revisiting a price level that previously held firm in February and twice during April.
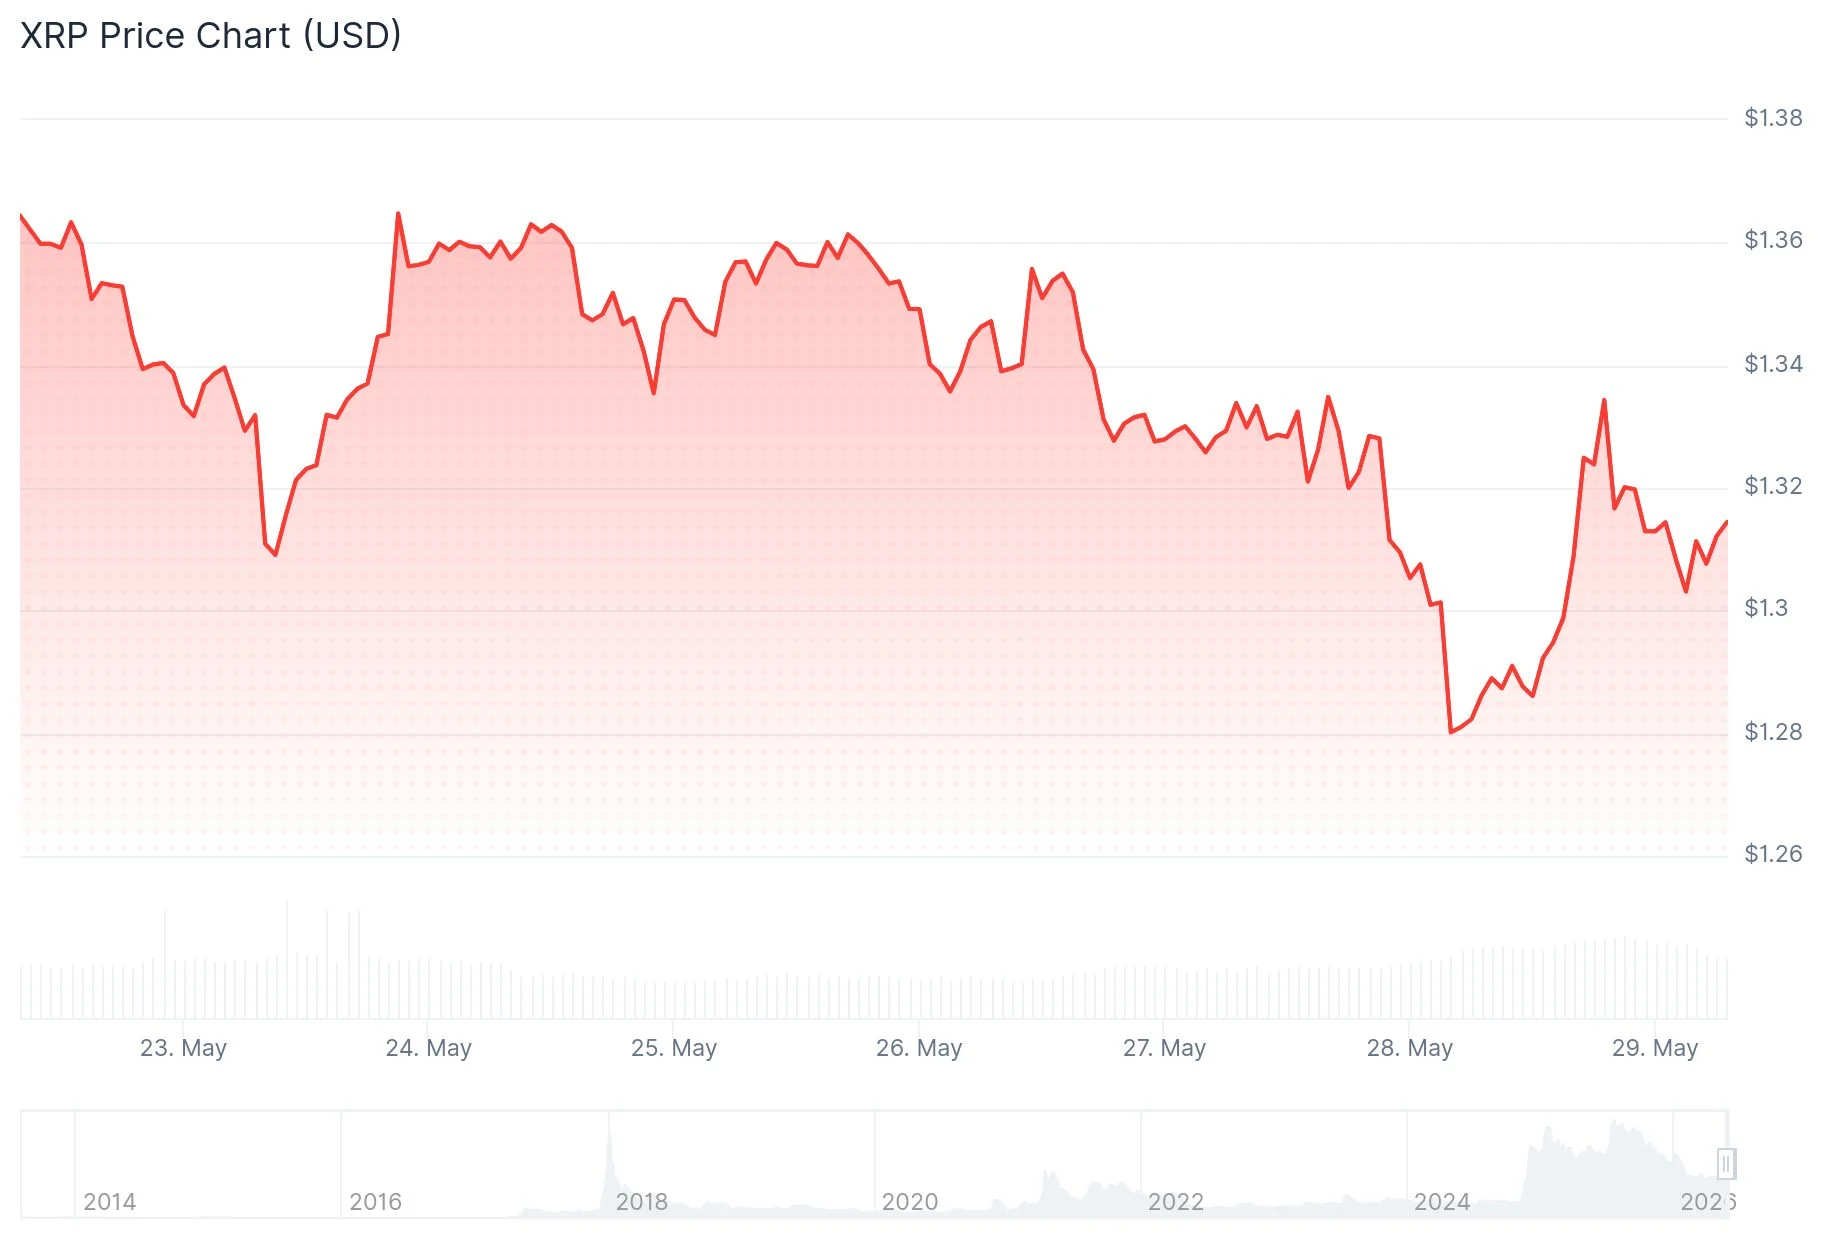
Following a peak of $1.5480 recorded on May 14, XRP has surrendered approximately 18% of its value over a two-week span. This downturn coincided with widespread selling pressure across cryptocurrency markets, affecting Bitcoin and numerous alternative coins.
The asset has begun showing signs of stabilization. On May 29, XRP rebounded past $1.29 before encountering selling pressure around $1.32. The token presently trades beneath its 100-hourly simple moving average.
Technical Pattern Analysis
Market participants are closely monitoring the $1.2710 support threshold. Three distinct rebounds from this level throughout the year have created what appears to be a triple-bottom formation, a configuration that technical traders frequently interpret as evidence of weakening downward momentum.

Additionally, a hammer candlestick is taking shape on the daily timeframe, characterized by a compact body and extended lower wick. This configuration commonly precedes temporary price recoveries.
Should XRP maintain its position above $1.2710, market watchers identify a potential rally toward $1.50, representing roughly a 15% gain from present levels. Critical resistance barriers stand at $1.3280, followed by $1.3420, and subsequently $1.3650.
Technical analyst ChartNerd shared on X: “$XRP has swept below the $1.30 guardrail and is now searching for the lowest daily candle close since early February. Current FIB support rests between $1.28/$1.24. It’s got to hold, or the $1 potential opens up sooner rather than later.” This assessment underscores the significance of the present support region.
A decisive break beneath $1.2720 would expose lower support targets at $1.2550, followed by $1.2250. Further weakness could test the 2025 low of $1.1176.
Exchange-Traded Fund Activity and RLUSD Growth
Despite downward price action, fundamental metrics paint a more optimistic picture. Spot XRP exchange-traded funds have recorded $118 million in net inflows during May, representing the strongest monthly performance in 2025 and ranking third-best since their initial launch.
Bitwise’s XRP ETF has independently accumulated over $446 million in cumulative inflows and currently manages $337 million in assets under management. Recent data indicates ETF investors purchased $1.77 million in XRP during a single trading session, pushing aggregate ETF-held net assets to $1.12 billion.
This contrasts sharply with spot Bitcoin ETFs, which recorded more than $2 billion in net outflows this month, while Ethereum-based funds experienced $401 million in redemptions.
The Ripple USD stablecoin (RLUSD) continues its expansion trajectory. The stablecoin now commands a $1.8 billion market capitalization, advancing from $697 million at launch. Adjusted trading volume reached $11.1 billion, marking a 61% monthly increase.
XRP concluded May 29 trading sessions near $1.30, with market participants focused on whether the $1.2710 support level will hold firm.
