



Key Takeaways
- Among the top 5 cryptocurrencies, ETH recorded the steepest decline at 12.6% over the past month.
- The cryptocurrency breached the critical $2,000 support zone, touching an intraday bottom of $1,964.
- A massive $138 million in long positions were liquidated within 24 hours — marking the second-largest liquidation event in three months.
- Market sentiment indicators show the Fear and Greed Index declining to 32, reflecting widespread investor anxiety.
- Technical analyst Ali Charts cautions that a weekly candle close under $1,850 may trigger a sharp decline toward $1,560 and potentially $1,070.
Ethereum (ETH) continues to face significant downward momentum. Over the last 30 days, the digital asset has shed 12.6% of its value, positioning it as the poorest performer among the five largest cryptocurrencies.
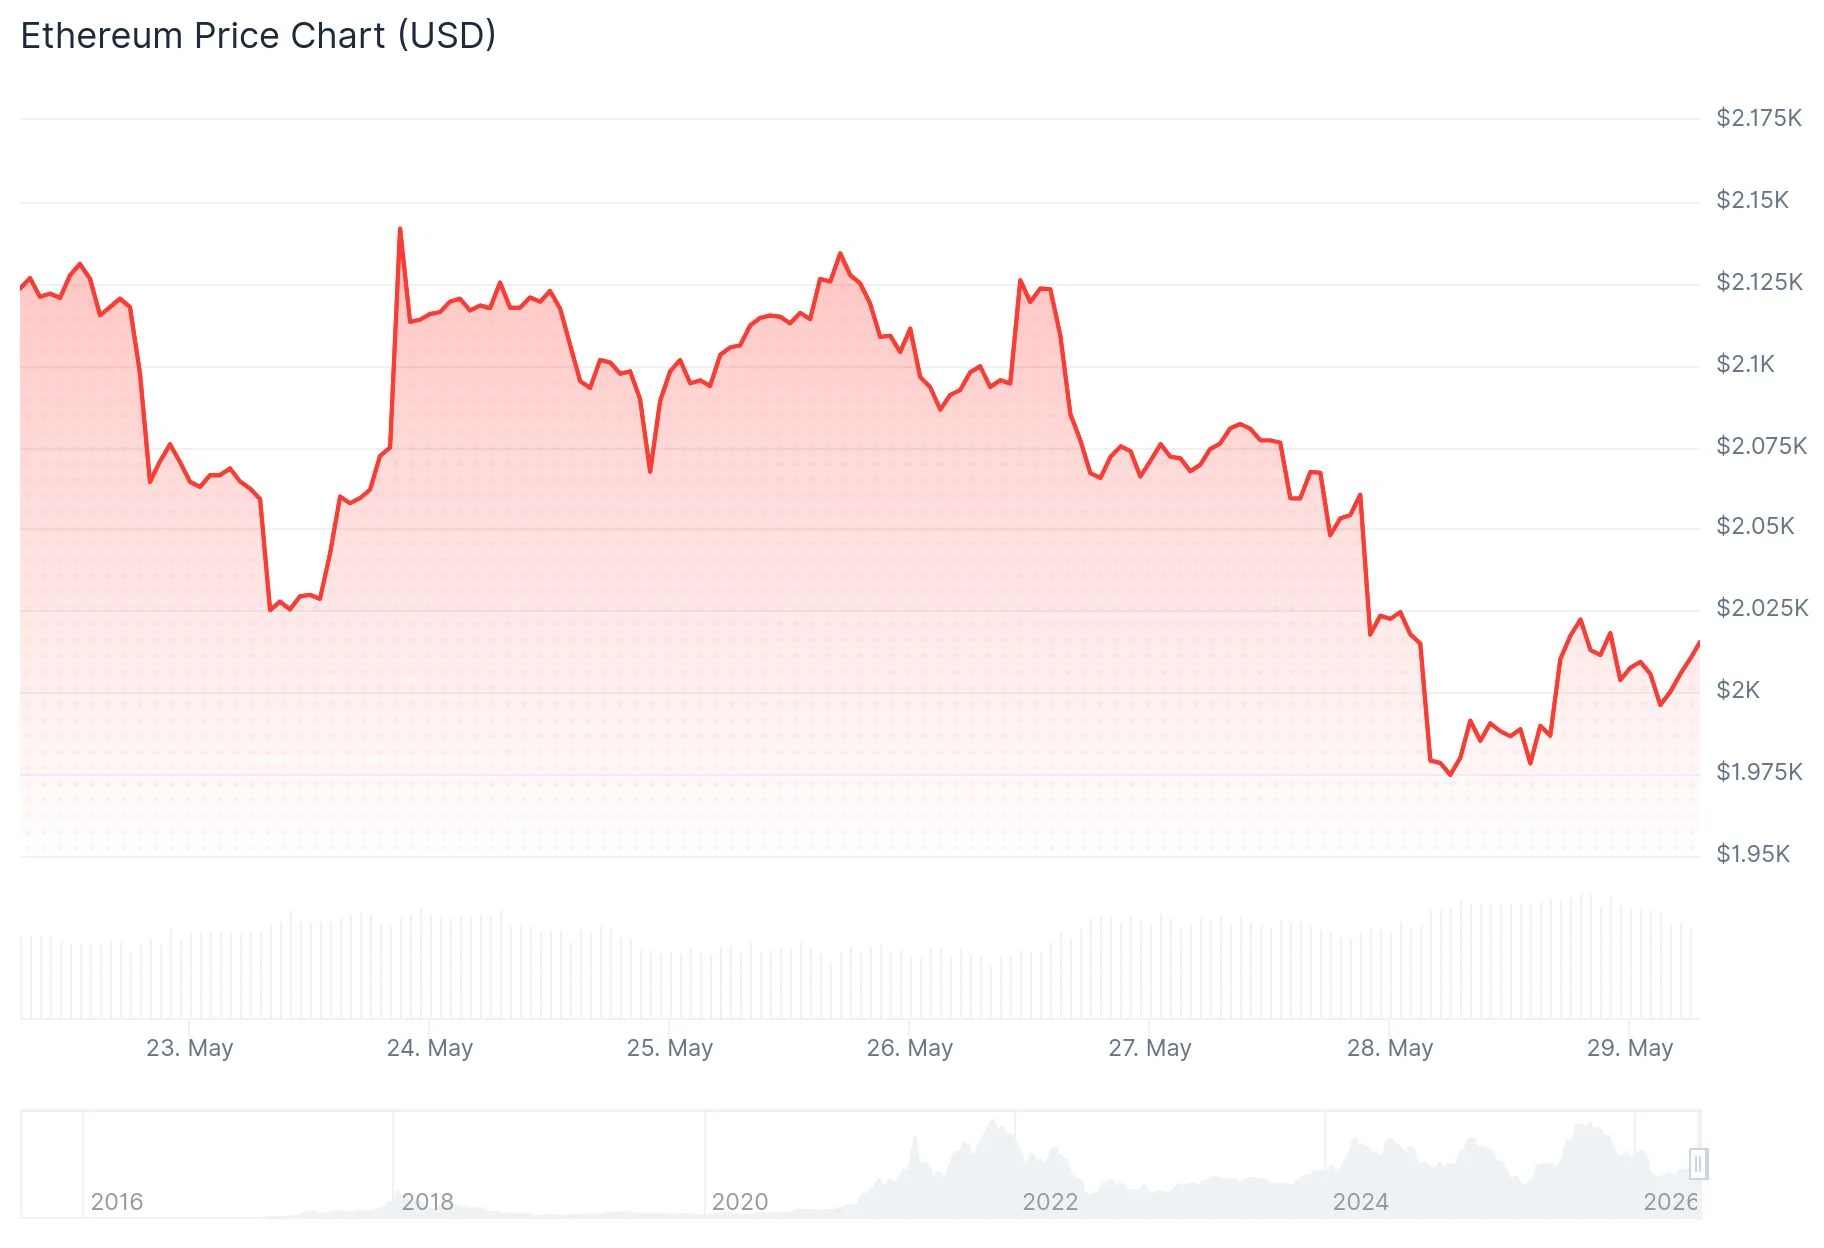
The selloff accelerated dramatically when ETH breached the $2,000 barrier — a crucial psychological benchmark that market participants monitor closely. The token reached a session bottom of $1,964 before experiencing a modest recovery.
Trading activity surged by 24% over the past day, reaching $18 billion. This volume represents approximately 8% of Ethereum’s total circulating market capitalization — a strong indicator that selling momentum is gaining traction.
Forced Liquidations Reach Three-Month Peak
The downward spiral has been amplified by a cascade of automatic position closures. Across cryptocurrency markets, long position liquidations totaled $861 million in a 24-hour period. Ethereum accounted for roughly one-quarter of these forced sales.

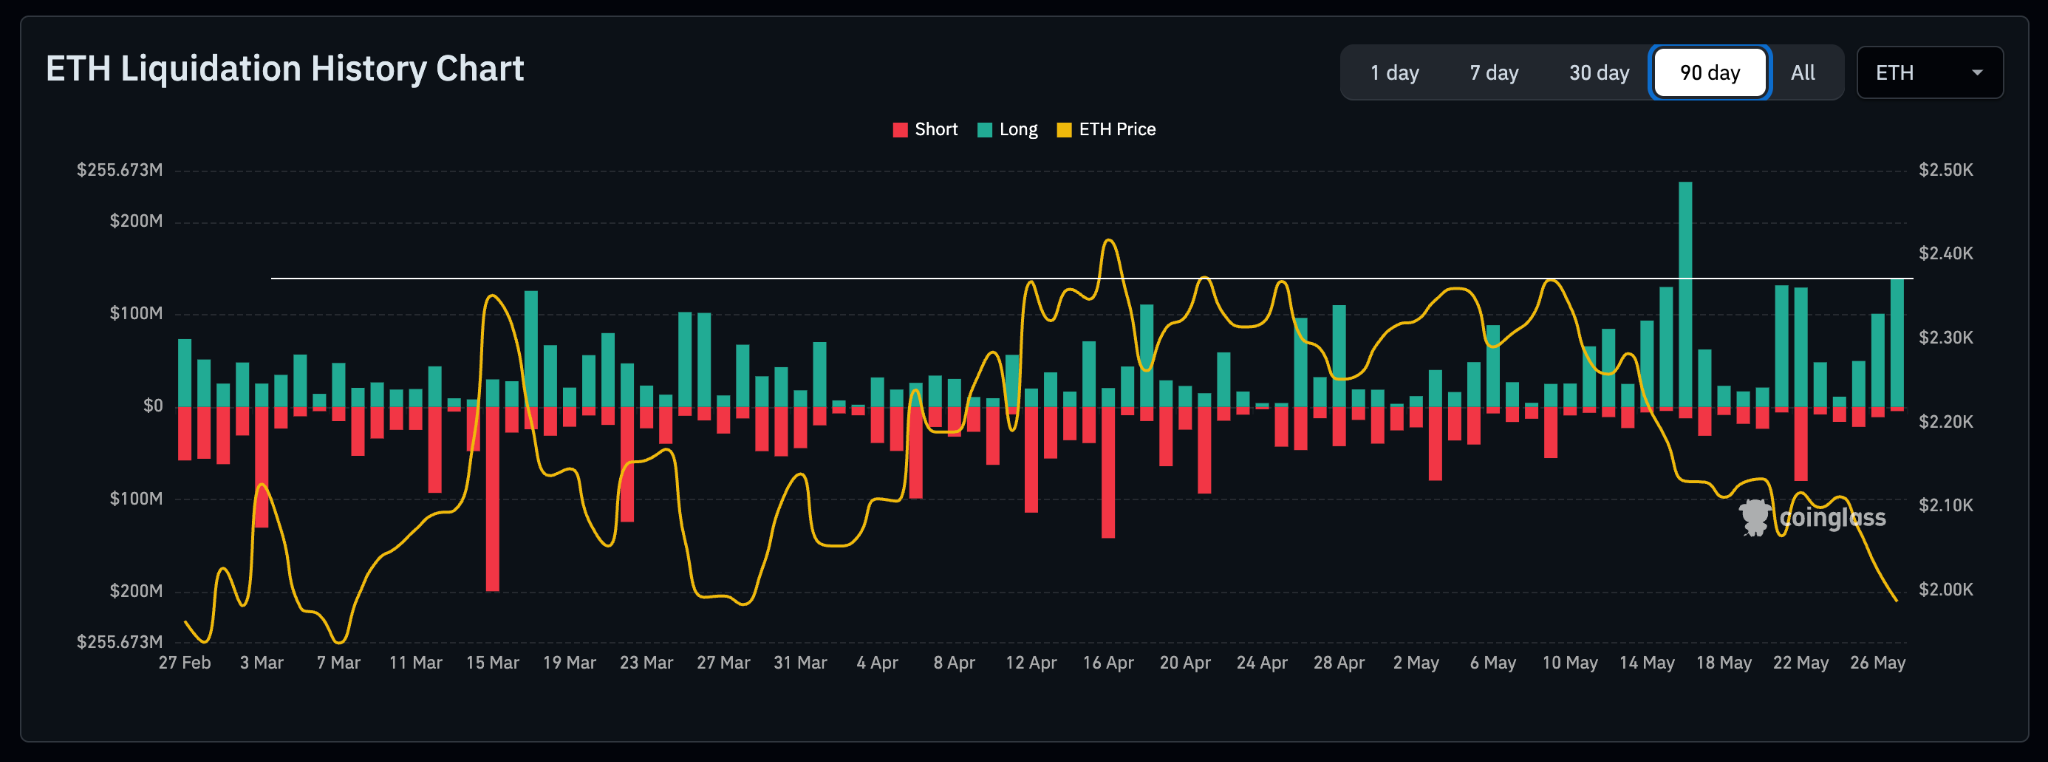
Just one day earlier, $138 million worth of ETH long positions were eliminated — representing the second-largest single-day liquidation event over the past 90 days. Such aggressive liquidation activity typically indicates a “long squeeze” scenario, where declining prices activate stop-loss orders, creating additional downward pressure.
Crypto analyst Ali Charts highlighted the critical situation via social platforms: “If Ethereum $ETH prints a weekly close below $1,850, a downside acceleration becomes highly likely.” He identified two significant downside objectives — $1,560 serving as intermediate support, and $1,070 marking the lower boundary of the extended trading range. His analysis draws from channel pattern formations and recent price rejections.
Investor confidence has deteriorated in tandem with price declines. The Fear and Greed Index has fallen to 32, a level last observed in early February, placing market sentiment squarely in the “Fear” category.
Technical Analysis Reveals Critical Levels
On shorter timeframes, resistance zones are building up. A descending trendline has emerged with immediate resistance positioned around $2,010. Beyond that barrier, additional obstacles appear at $2,020 and $2,050.
For those maintaining bullish positions, the crucial support level stands at $1,965. A breakdown below this threshold would expose subsequent supports at $1,950, followed by $1,920, and ultimately $1,850.
From a macroeconomic perspective, the latest U.S. PCE inflation reading registered at 3.3% — matching forecasts but elevated enough to eliminate prospects for interest rate reductions this year. This development diminishes expectations for any near-term catalyst from accommodative monetary conditions.
A significant pattern being monitored by technical analysts involves the weekly Relative Strength Index. Historical data from 2019 and 2022 demonstrates that whenever the RSI declined to 30 or lower, it consistently marked the conclusion of bearish phases. In both instances, price action retested cycle lows before initiating recoveries. The RSI currently hovers near that identical threshold, indicating a potential retest of the $1,750 cycle bottom remains a viable scenario.
ETH is presently hovering around the $2,000 level, with a bearish trendline limiting upside attempts at $2,010.
