
 Analysis: Liquidations Surge Past $220M as Volatility Peaks")
Key Takeaways
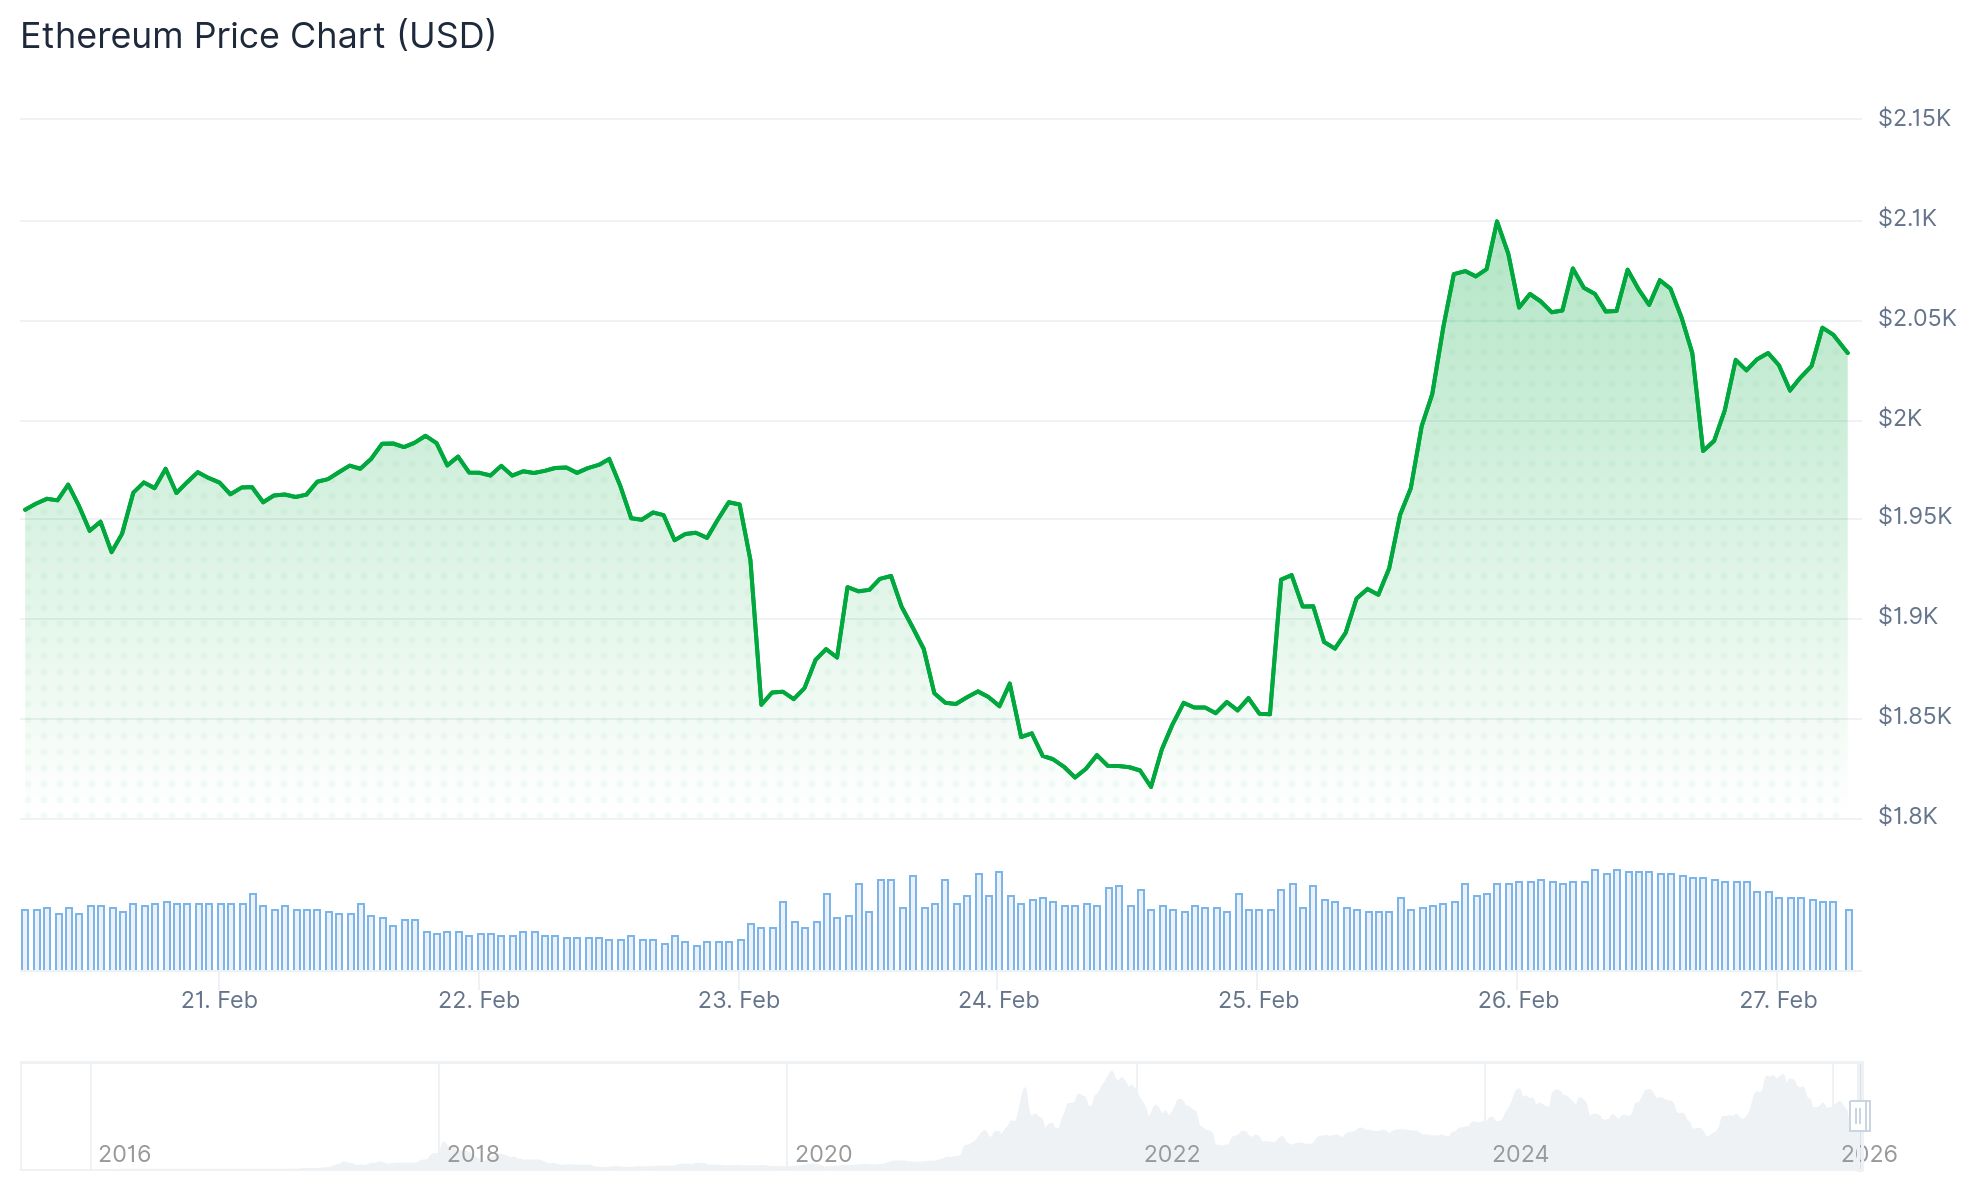
- Ethereum reached $2,150 on Thursday, marking its highest point of the week, though multiple technical barriers remain
- The critical $2,100 threshold corresponds to the average cost basis for wallets controlling 100,000+ ETH
- Realized volatility over 30 days approaches 0.97, marking the most volatile period since March 2025
- Over $220M in short positions were liquidated across 48 hours, with funding rates shifting into positive territory
- ETF outflow pressure appears to be diminishing, although strong accumulation trends have yet to materialize
Ethereum’s price action saw a notable push to $2,150 on Thursday before experiencing a retreat. Currently, the asset is consolidating within a defined range, with $2,000 serving as crucial support while $2,100 represents the next significant resistance zone.
Securing a daily candle close above $2,100 holds particular significance as this price point aligns with the realized price for addresses containing 100,000 ETH or more. The realized price metric represents the average acquisition cost based on the last on-chain movement, providing insight into whether major stakeholders are currently profitable.
Historically since 2020, ETH has rarely dipped below this whale segment’s cost basis, with the most notable occurrence during the 2022 bear cycle. Previous tests of this threshold have typically preceded price recoveries.
Derivatives Market Dynamics
The past 48 hours witnessed short liquidations exceeding $220 million, effectively wiping out significant bearish leverage positions. Binance funding rates, which had plunged into deeply negative territory earlier this month as short interest accumulated, have reversed course to reach positive 0.23%.

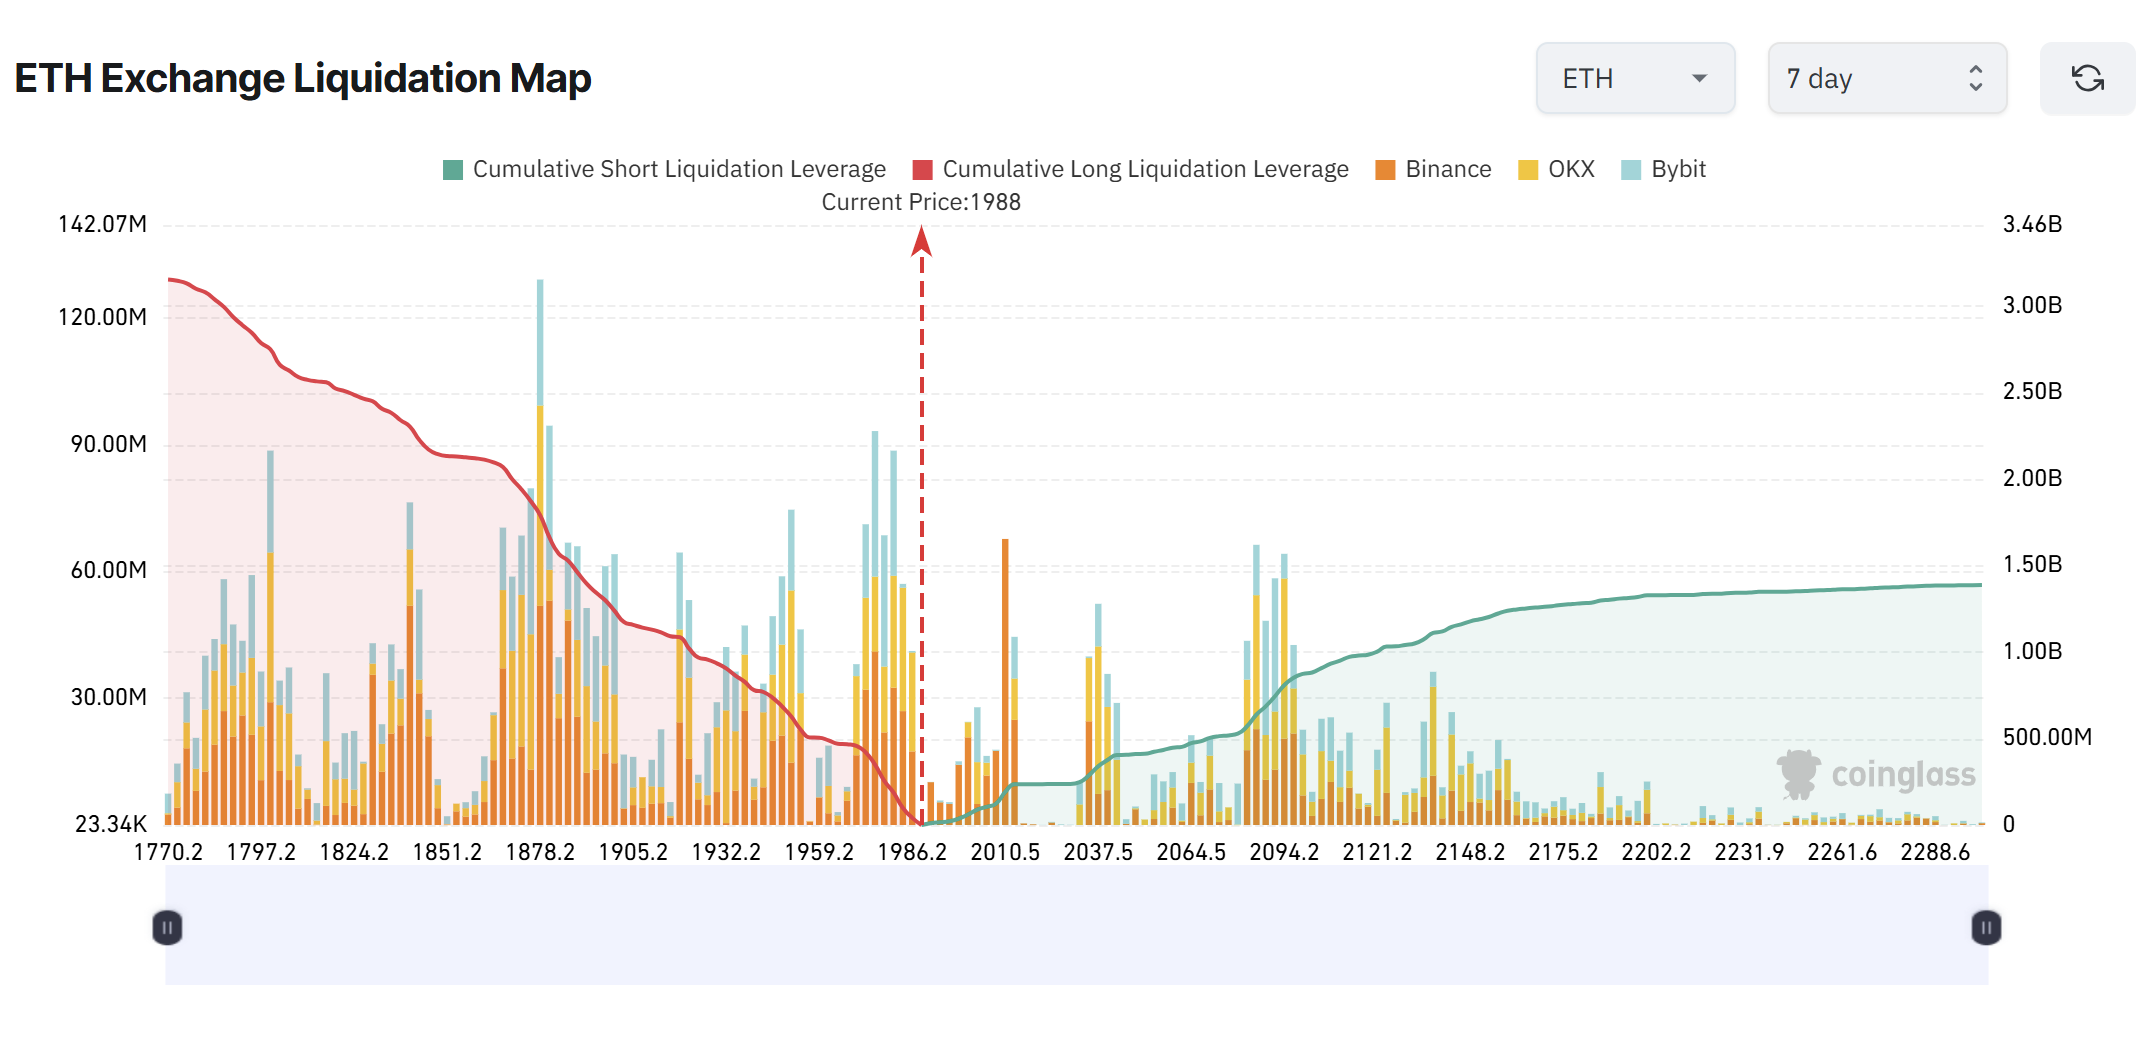
This reversal indicates that bearish traders entering late positions were forced out. Nevertheless, the current elevated funding rate suggests increasing long-side bias, creating potential vulnerability for a long squeeze targeting the $1,800 region should upward momentum fade.
Approximately $2.66 billion in long position liquidation levels cluster around $1,800, establishing a significant liquidity pocket beneath current trading levels.
Market Volatility and Institutional Activity
Ethereum’s 30-day realized volatility on Binance has climbed near 0.97, representing the highest measurement observed since March 2025. Such heightened volatility often indicates market indecision and price discovery rather than established directional momentum.
The current price action remains suppressed below all major moving averages including the 50-, 100-, and 200-day lines. Each rally attempt following the rejection from approximately $4,800 in late 2025 has established progressively lower peaks, suggesting ongoing distribution pressure.
Regarding spot ETF activity, selling momentum has begun to moderate. Following substantial outflows throughout mid-2025, recent data reveals reduced flow magnitudes in either direction. While institutional distribution appears to be waning, definitive accumulation patterns have not yet emerged.
Market analyst Leon Waidmann observed that retail participants with weak conviction have predominantly exited positions. Bearish positioning is declining, while aggressive long positions have been slow to build.
Technical analyst IncomeSharks identified three key resistance zones, including multiple SuperTrend indicator rejections and channel resistance approaching $2,250. The analyst also highlighted April’s low around $1,500 as a critical downside level should buying pressure deteriorate.
At press time, ETH was changing hands at $2,034.