
 Stock: Critical Fibonacci Level Could Trigger Breakout")
Key Takeaways
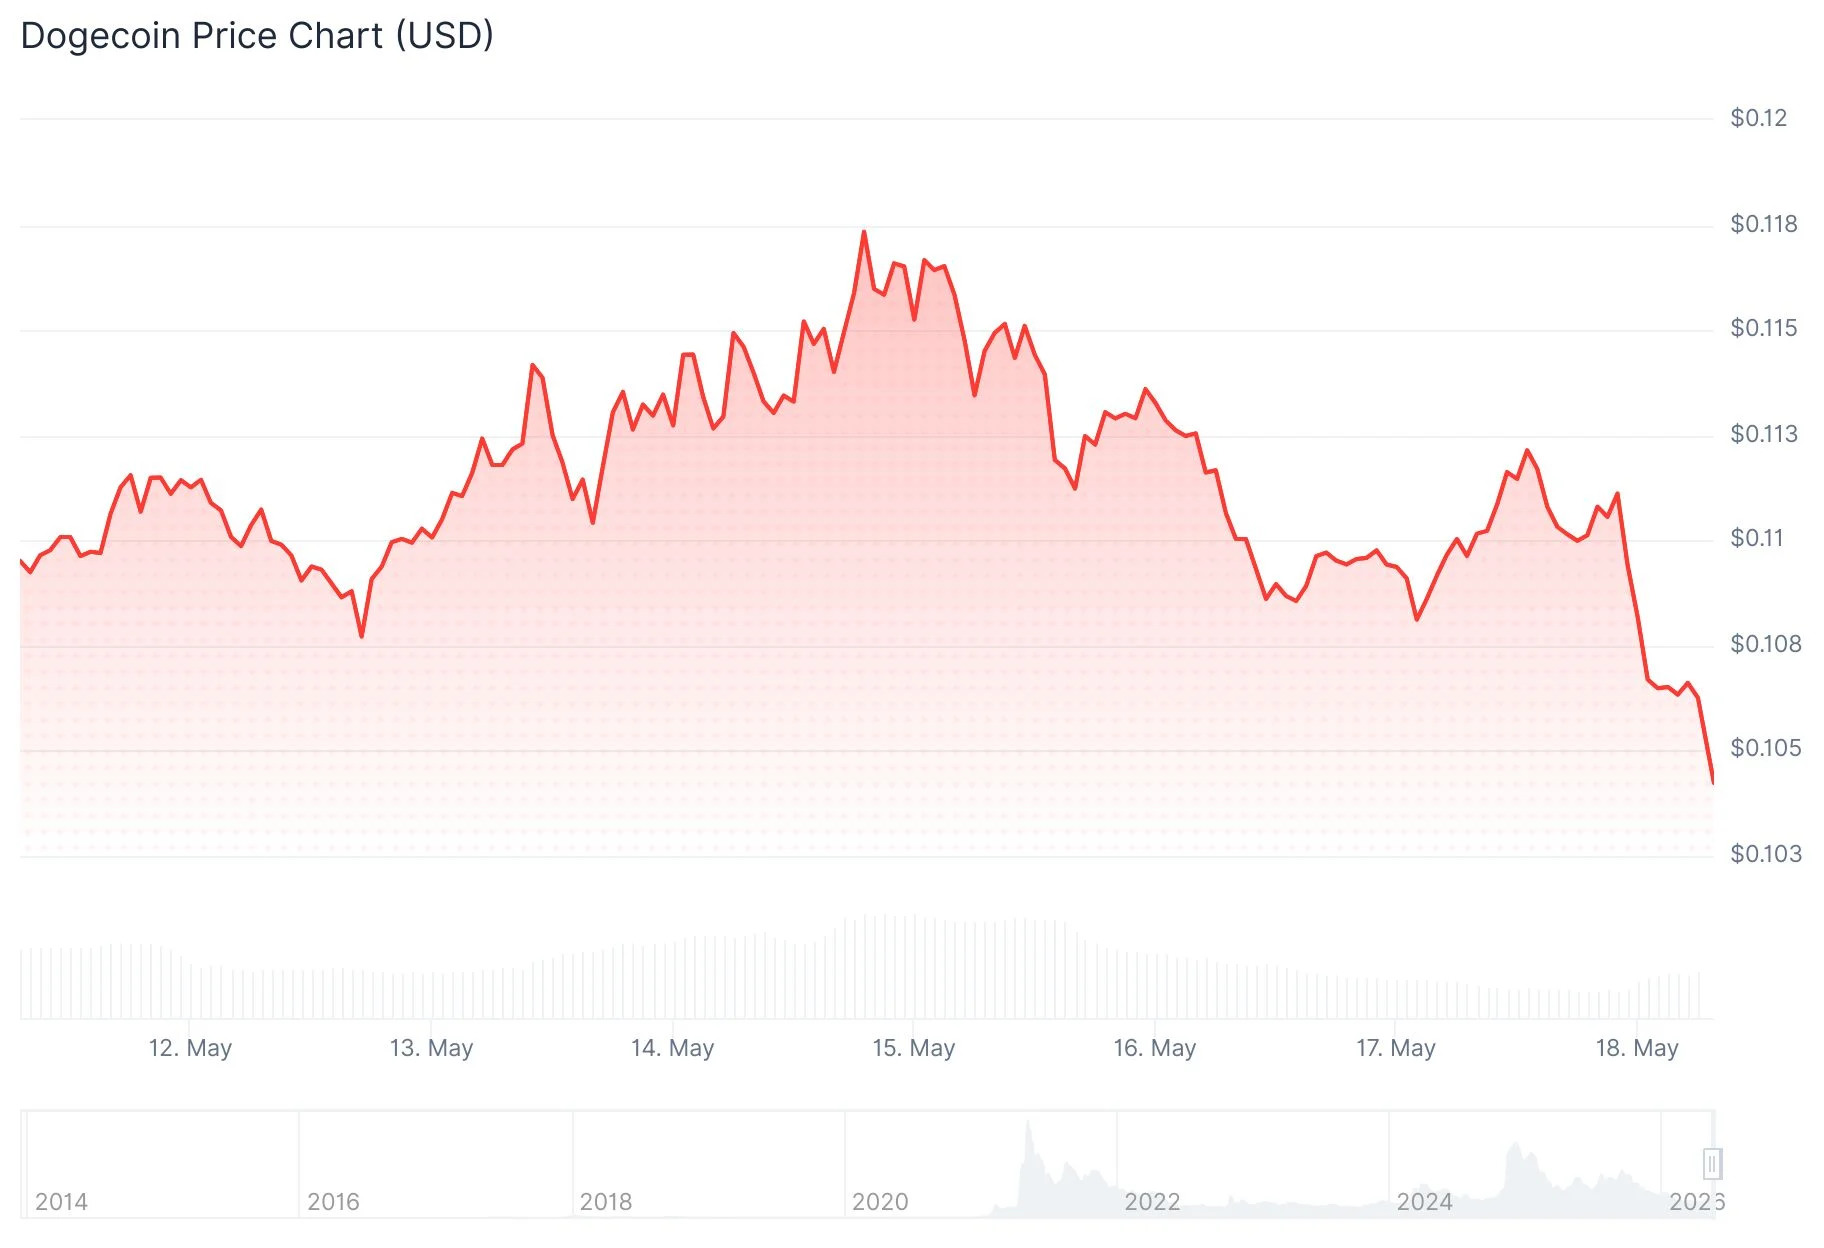
- DOGE currently trades between $0.1102 and $0.1105 with an $18.73 billion market capitalization
- The token faces a critical test at the 0.618 Fibonacci resistance positioned at $0.11799
- Crypto analyst BitGuru identifies potential upside toward the $0.13-$0.15 zone with building momentum
- Open interest and trading volume in derivatives markets have declined, with volume down 39%
- Technical analyst Cryptollica draws parallels between current conditions and historical cycle lows from 2015, 2020, and 2022
As of May 17, 2026, Dogecoin holds steady around the $0.1105 price point, reflecting a modest 24-hour increase of 1.23%. The meme cryptocurrency maintains a market capitalization of $18.73 billion while recording $1.29 billion in daily trading activity.
Recent sessions have shown primarily horizontal movement without clear directional momentum. However, the technical formation developing on the charts has captured the interest of multiple market analysts.
Cryptocurrency technical analyst BitGuru shared insights via X on May 17, highlighting that DOGE experienced a liquidity sweep followed by a period of price stabilization. According to his assessment, sustained momentum development could propel the token into the $0.13 to $0.15 price corridor. BitGuru emphasized he’s actively monitoring this configuration for breakout signals.
Examining the weekly timeframe reveals that DOGE recovered from the 0.786 Fibonacci support zone around $0.08042. The subsequent rally has brought price action back toward the 0.618 Fibonacci resistance barrier at $0.11799, establishing this level as the primary focal point.

Market observer Surf commented that the pullback appears constructive from a technical perspective, suggesting the $0.10 zone should function as reliable support. He drew comparisons to a 2024 price pattern where DOGE rebounded from comparable territory before initiating a significant upward movement.
Critical Price Zones Under Observation
A weekly candle closing above the $0.11799 threshold would represent a bullish development. Successfully clearing this barrier would shift attention toward subsequent resistance targets near $0.14 and $0.17, according to Fibonacci extension analysis.
Should DOGE encounter rejection at this resistance, market participants will look toward the $0.095 to $0.10 region to provide downside support.
Historical Cycle Analysis
Taking a macro perspective, analyst Cryptollica presented a comparative framework examining current market conditions against previous cyclical lows. His analysis categorized earlier phases with sentiment labels: “disbelief” during 2015, “boredom” throughout 2020, and “anger” in 2022. The current environment, according to his interpretation, represents another sentiment recalibration period where enthusiasm and momentum have diminished ahead of a potentially significant future advance.
This framework doesn’t forecast an imminent price surge. Rather, it provides historical perspective on where DOGE currently stands within longer-term market cycles.
Derivatives market data reveals declining engagement, with open interest falling 0.79% to reach $1.52 billion over the past 24 hours. Trading volume experienced a sharper contraction of 39.17%, settling at $1.62 billion—an indication that numerous market participants have adopted wait-and-see positions.
Meanwhile, the funding rate maintains a marginally positive reading at 0.0006%, implying that a portion of leveraged traders continue to position for near-term appreciation.
DOGE has yet to validate a definitive breakout pattern. The 0.618 Fibonacci resistance at $0.11799 stands as the immediate decisive test determining the token’s next directional move.