
 Stock: Institutional Buyers Load Up as Price Tests Critical Resistance Levels")
Key Highlights
- Ethereum currently trades at $2,316.20, reflecting a 2.08% gain over 24 hours
- Investment firm Jane Street boosted Ethereum ETF holdings by approximately $82 million during Q1 2026
- Large sell walls positioned by whales around $2,320 and $2,400 are limiting upward momentum
- Technical analysts indicate ETH requires a decisive move above $2,323 to confirm bullish reversal
- Critical support remains anchored at $2,247, coinciding with the 50-day moving average
Ethereum maintains its position above the $2,300 threshold as increasing institutional participation collides with significant whale-driven resistance in determining near-term price trajectory.
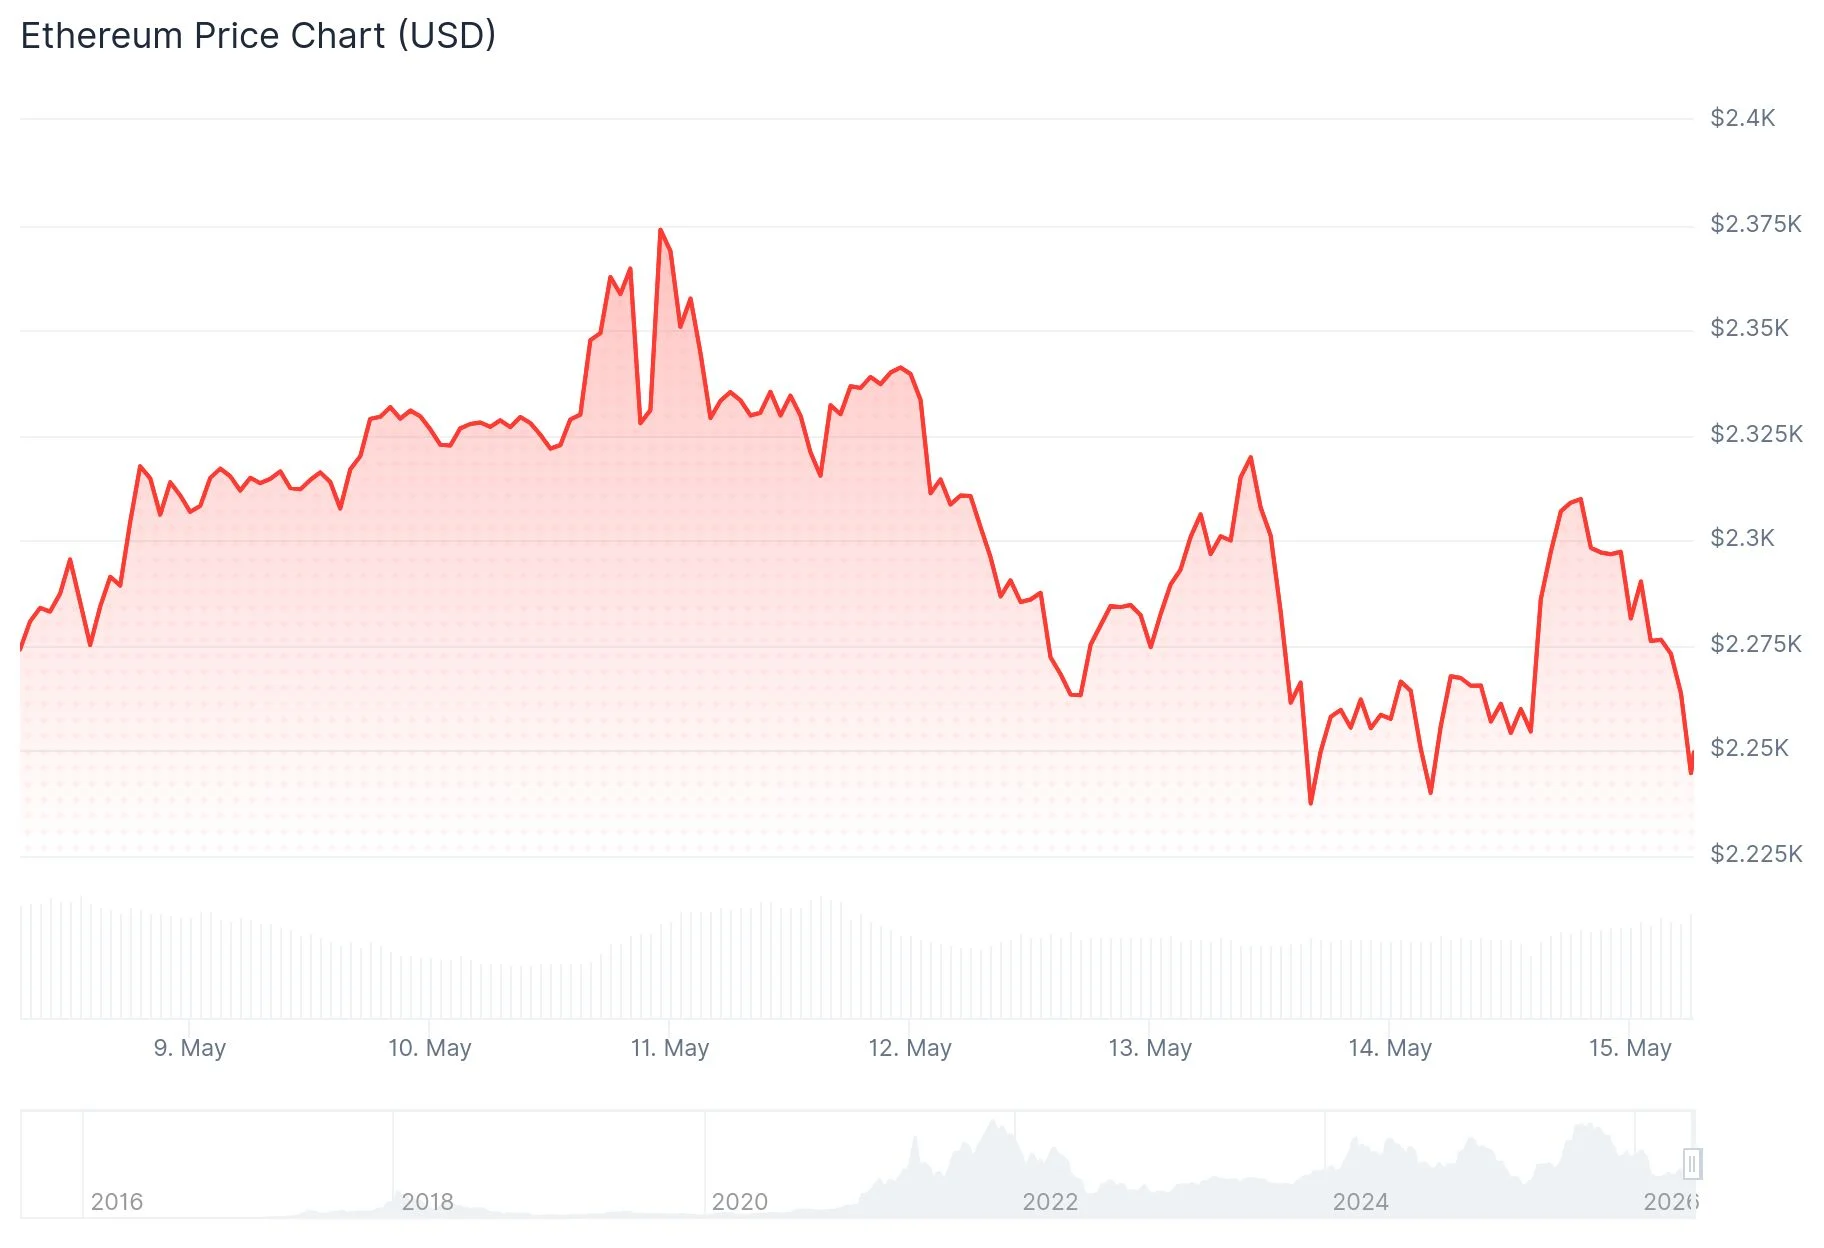
Current market data shows ETH changing hands at $2,316.20, registering a 2.08% increase during the previous 24-hour period. Transaction volume reaches $24.12 billion daily, supporting a total market capitalization of $277.94 billion.
Market analyst Ted Pillows highlighted via X that ETH recently validated the $2,250 support area. According to his assessment, maintaining this level could propel Ethereum toward the $2,350–$2,400 range, while failure to hold support might trigger a decline toward $2,150 or beneath. This interpretation aligns with current technical chart formations.
Regarding institutional activity, prominent investment bank Jane Street expanded its Ethereum ETF allocation by roughly $82 million throughout Q1 2026. Simultaneously, the institution decreased its holdings in Bitcoin and MicroStrategy.

Large-Scale Whale Resistance Creates Price Ceiling
Cryptocurrency analyst CW identified that Binance-based whales have established a substantial sell wall approaching $2,400. An additional, smaller resistance point from Coinbase whales exists near $2,320. These layered resistance formations are constraining ETH’s recovery trajectory.
ETH rebounded from a recent bottom around $2,233 but has encountered difficulty sustaining elevated price levels. The $2,320 threshold represents the initial hurdle that buyers must overcome.
On May 14, analytics platform Alphractal observed that Ethereum’s “Realized Cap Impulse” maintained positive territory despite a 3% price decline. This metric indicates continued capital inflows to the network, even amid price weakness.
Technical Analysis Reveals Mixed Signals
The Relative Strength Index presently registers 49.94, positioned marginally beneath the neutral 50 threshold. The 50-day moving average establishes itself at 52.88. The MACD indicator reads 8.29, trailing the signal line at 17.92, accompanied by a negative histogram value of -9.63, signaling diminishing near-term momentum.
Analyst More Crypto Online indicates ETH’s Elliott wave formation hints at an ongoing corrective phase. The $2,220–$2,230 zone represents the crucial support territory that bulls must protect.
Should ETH prove unable to penetrate $2,323, chart patterns suggest potential retesting of lower trend support levels. Successfully clearing this barrier would establish $2,380 as the subsequent resistance objective.
Latest market information confirms ETH stabilizing around the $2,316 zone, with institutional capital continuing to enter the market while traders monitor critical technical thresholds closely.