
 Rallies 10%: Technical Breakout Signals Path to $110")
TLDR
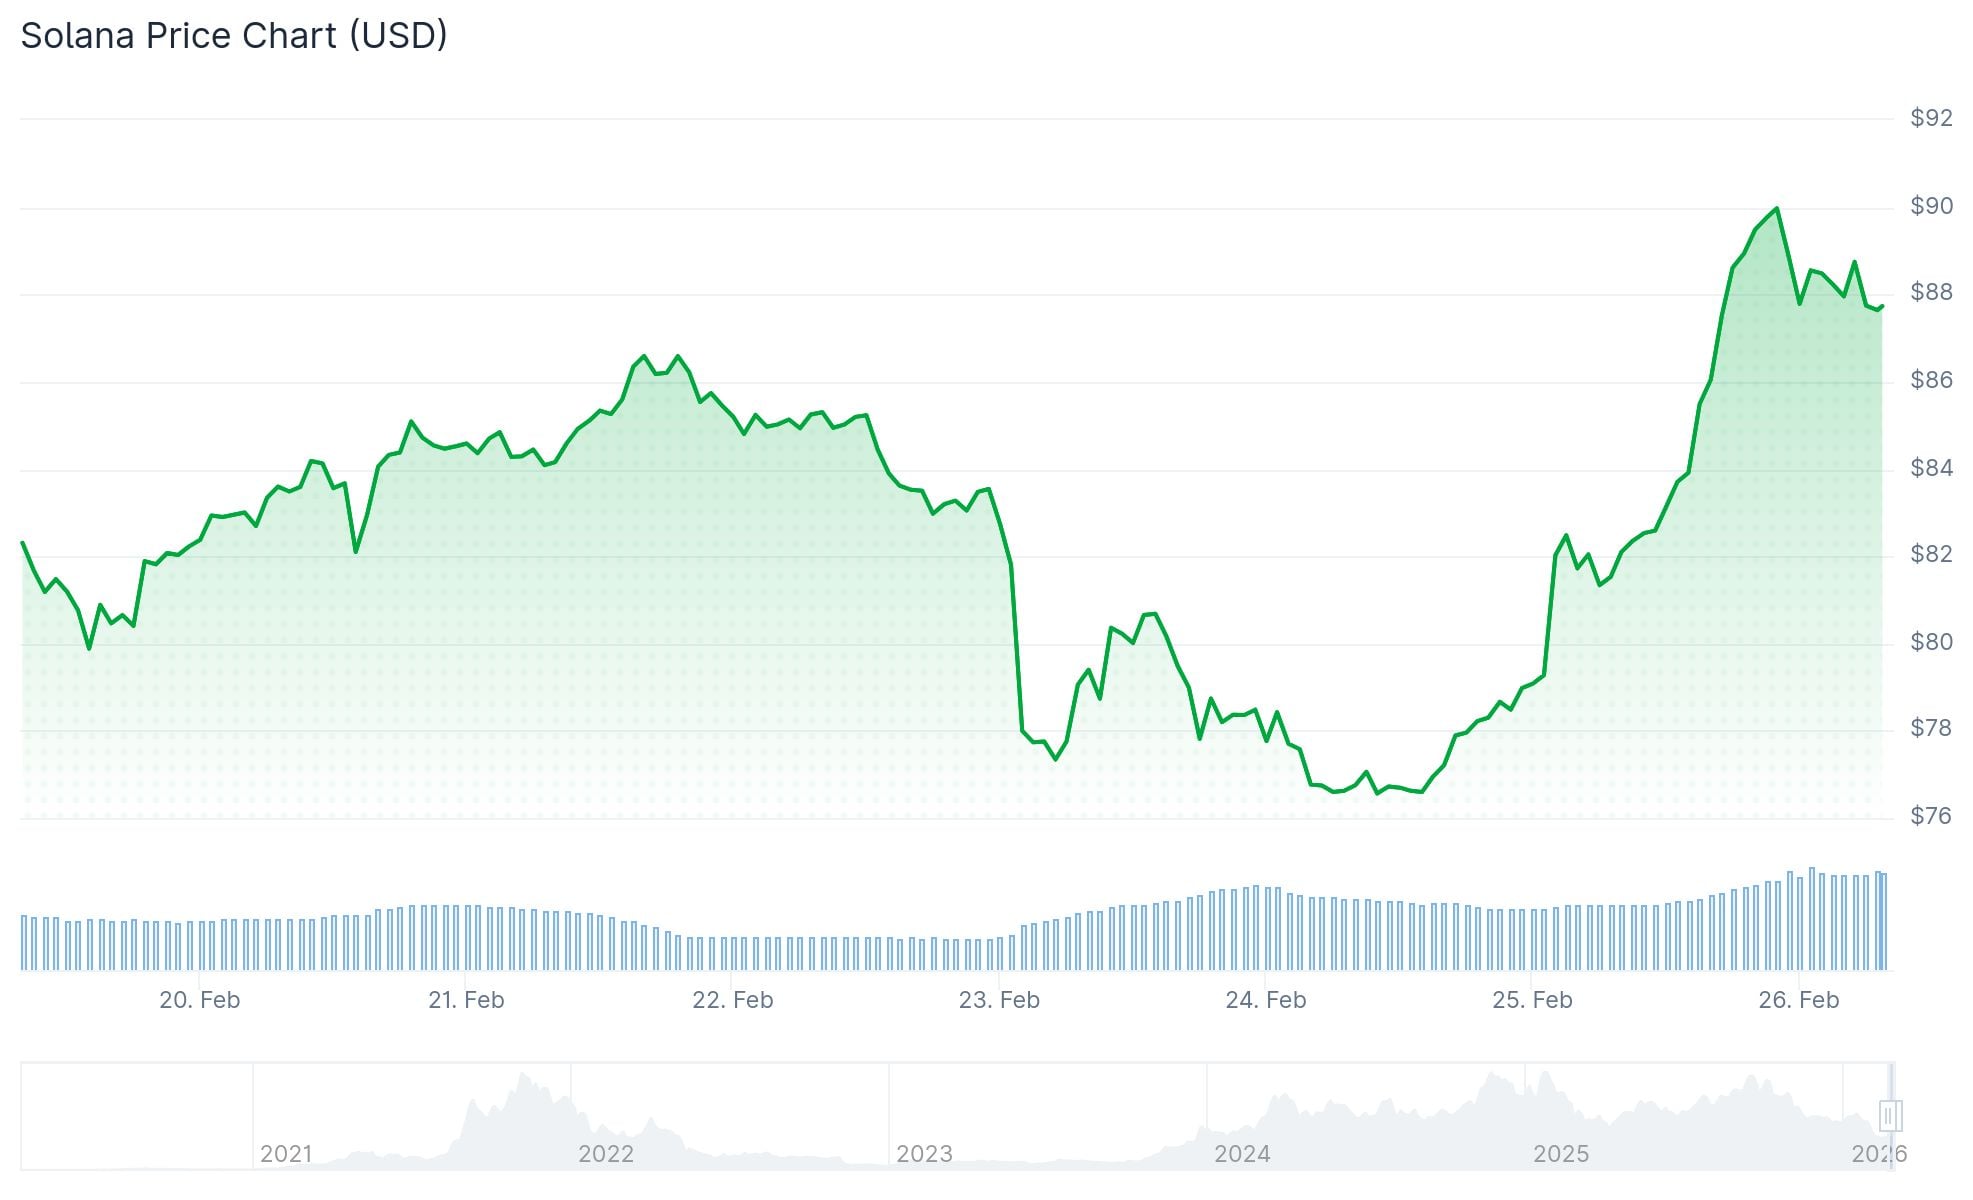
- SOL rallied 10–13% over 24 hours, hitting an intraday peak around $89
- Bitcoin’s climb back above $67K sparked renewed momentum across altcoins
- Bitcoin spot ETFs in the US attracted $258 million in net inflows on Feb. 24
- Solana spot ETFs have accumulated $40 million in net inflows from Feb. 9 onward
- Critical resistance zones for SOL are positioned at $90, $95, and $100
Solana’s value spiked more than 10% during a 24-hour window, rising from a two-week bottom of $75 to touch an intraday peak near $89. This upward movement coincided with a broader cryptocurrency market rebound, elevating the total market capitalization to approximately $2.28–$2.38 trillion.
Bitcoin spearheaded the recovery, climbing over 5% to settle in the $66,800–$68,000 range. This resurgence provided tailwinds for prominent altcoins, with Ethereum advancing 8%, XRP gaining 6%, and Dogecoin also recording positive momentum.
Institutional appetite remained strong as US-based spot Bitcoin ETFs attracted $258 million in net inflows on February 24. Fidelity’s FBTC dominated with $82.8 million, signaling continued institutional accumulation.
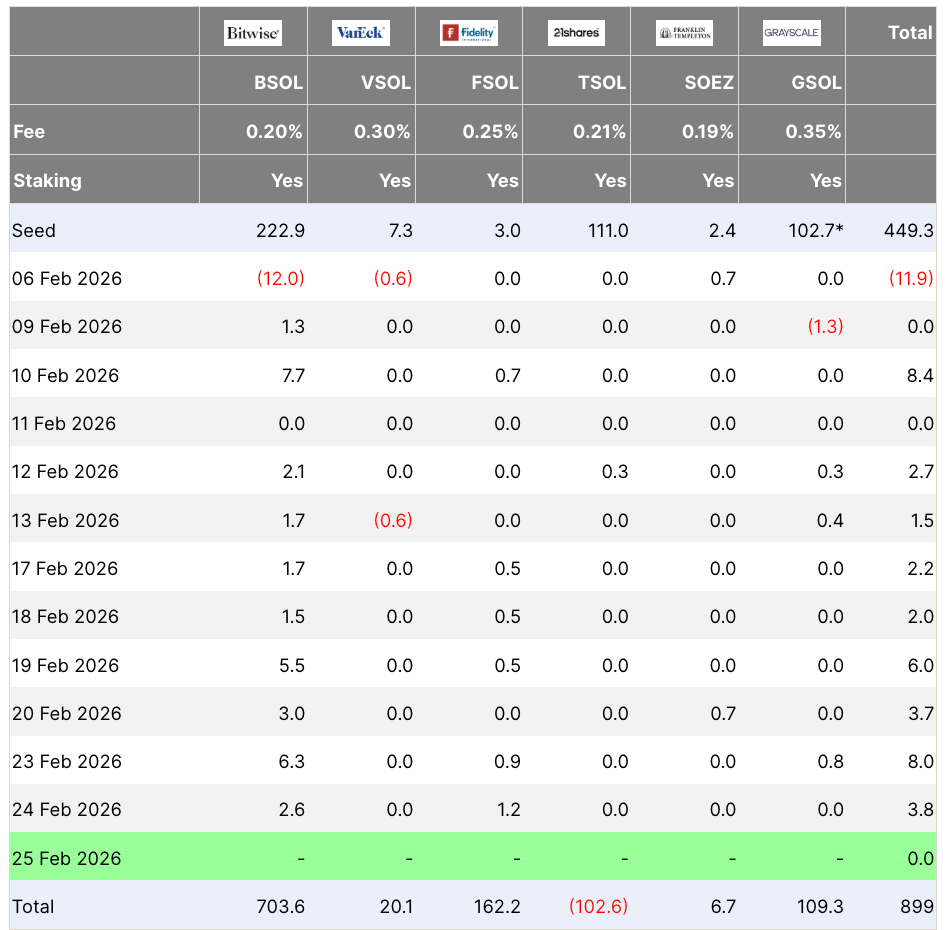
Demand specific to Solana gained traction as well. Since February 9, spot Solana ETFs have registered $40 million in cumulative net inflows, contributing additional upward pressure on SOL’s price action.

Open interest in SOL contracts expanded by over 5% to reach $5.27 billion during this price surge. Concurrently, short positions worth $15.4 million were liquidated throughout the same 24-hour timeframe.
Technical Breakout in Play
Analyzing the six-hour timeframe, SOL successfully breached a symmetrical triangle formation. The projected target derived from this breakout extends to $110, which coincides with the 50-day simple moving average level.
Maintaining this upward trajectory requires price support above the 100-day SMA positioned at $86. A confirmed daily close exceeding the 20-day EMA at $88 could unlock pathways toward $95 and subsequently $117, per market analysts.
Glassnode metrics reveal sparse historical acquisition activity above $85, suggesting fewer holders face unrealized losses in this price zone. This dynamic could minimize selling pressure from overhead resistance in the immediate future.
The RSI registered 72.84 during reporting, indicating overbought conditions. Meanwhile, the MACD displayed a bullish crossover with histogram values hovering around 1.20.
What Needs to Happen Next
Market observers suggest that Bitcoin establishing support above $72,000 could catalyze Solana‘s next upward phase toward the $100 milestone.
Near-term resistance for SOL appears at $90, followed by $95, with $100 representing a significant psychological threshold. Beyond that level, major resistance emerges around $115, where approximately 22 million SOL tokens were historically accumulated.
This week’s macroeconomic calendar includes Thursday’s jobless claims report, Friday’s January Producer Price Index release, and scheduled remarks from eleven Federal Reserve officials.
At the time of this report, SOL was exchanging hands at $88.56, having recorded a session peak of $89.19 and a floor of $85.98.