
 Stock Rebounds Above Realized Price, Eyes $3,000 Target")
Key Highlights
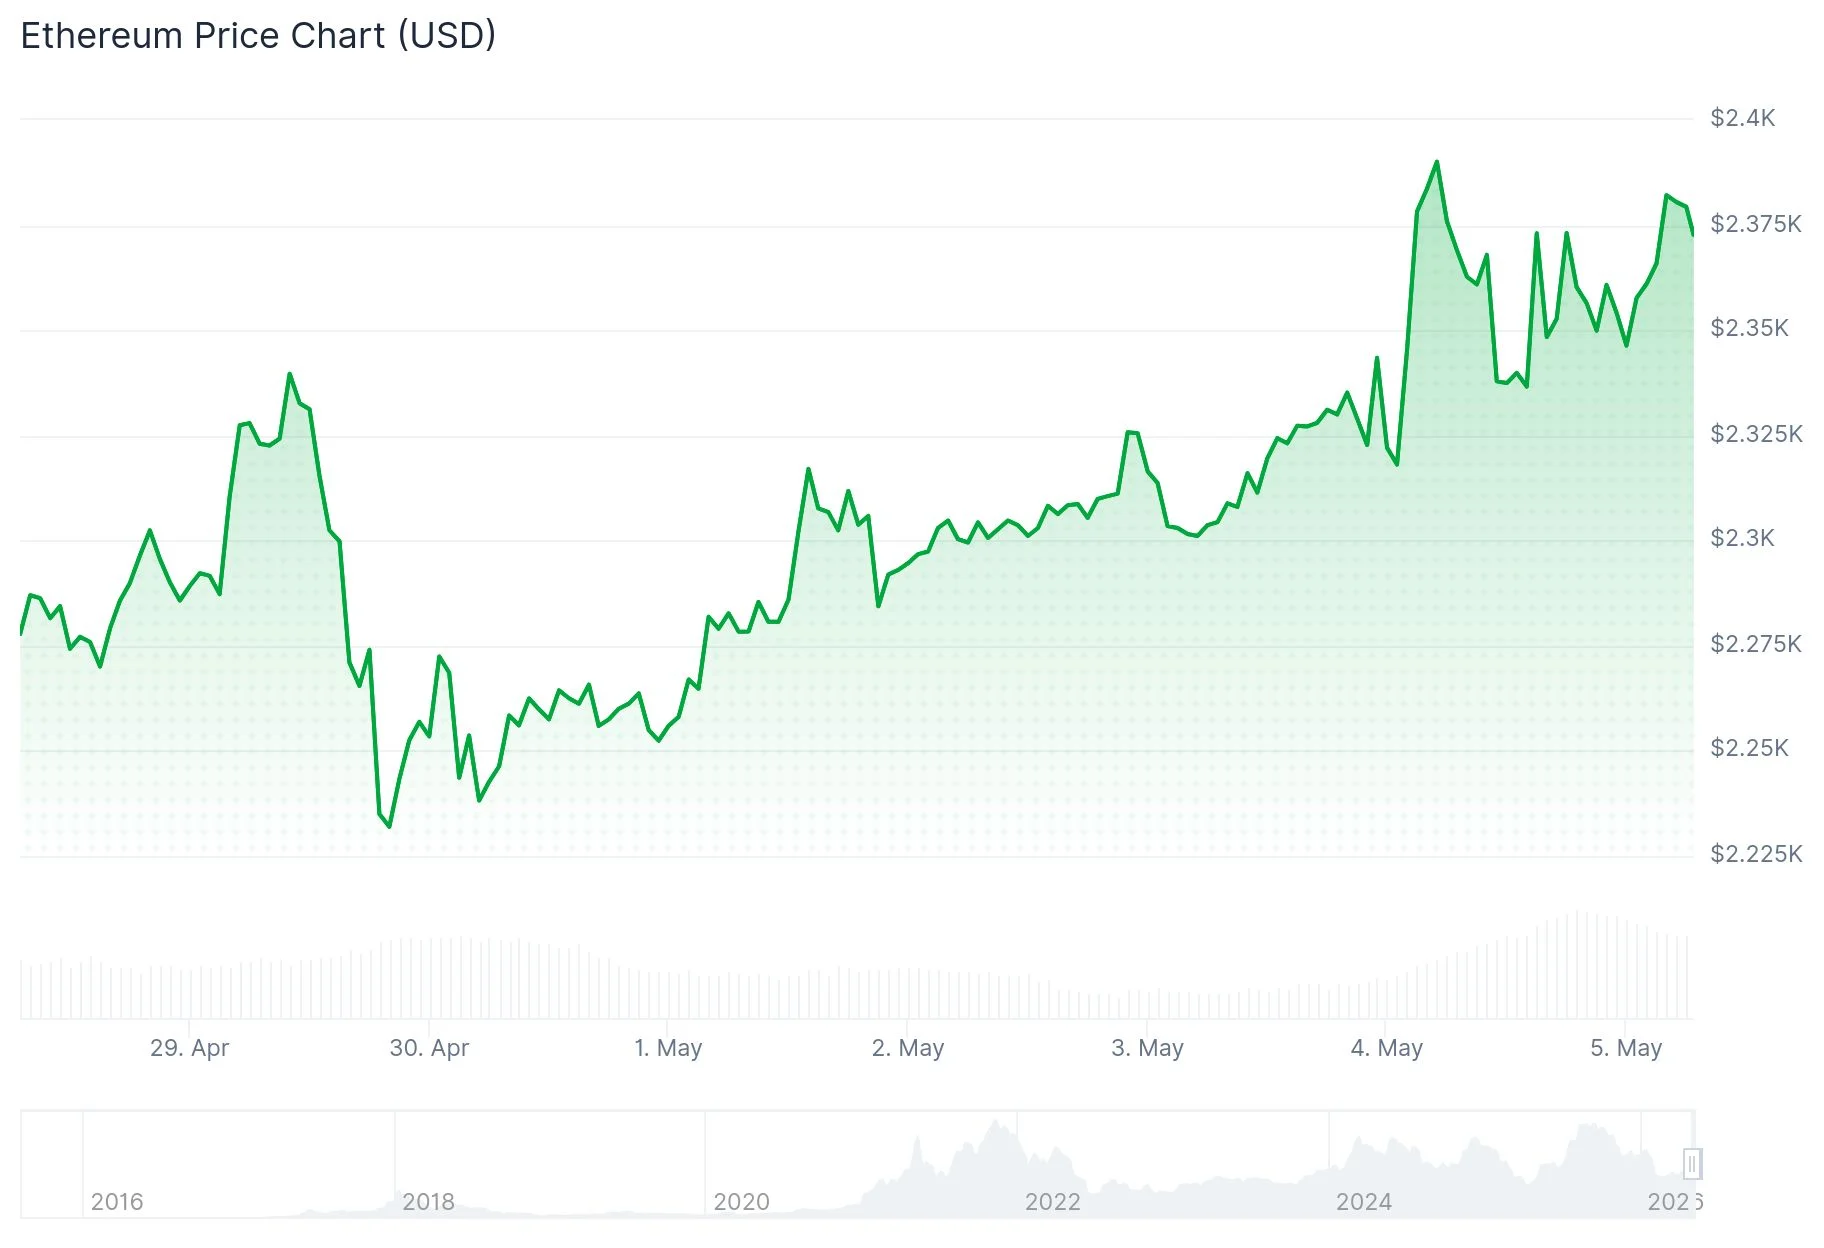
- Ethereum rallied to $2,390, breaking above its $2,320 realized price level, putting average holders into profit territory
- Technical analysis reveals a bull flag formation on daily charts with a measured move projection to $3,018
- Crypto analyst Dami-Defi forecasts a “violent move” to $2,800–$3,000 once ETH breaches the $2,400 resistance
- A significant concentration of 7.1 million ETH accumulated between $2,750–$2,850 presents a formidable resistance zone
- Relative Strength Index has bounced to 56 after touching near-oversold territory at 36 in late March
Ethereum has successfully reclaimed its realized price threshold of $2,320, signaling that the typical ETH investor has emerged from unrealized losses. The second-largest cryptocurrency peaked at $2,398 during the session before settling near $2,376, registering a 2.2% increase over the last day with trading activity reaching $24.23 billion.
The realized price represents the aggregate cost basis across all ETH tokens that have transacted on the blockchain. Historically, surpassing this metric has catalyzed a psychological transition from bearish to bullish market sentiment.
When Ethereum breached this threshold in May 2025, it subsequently surged 173% to establish an all-time peak of $4,950. Similarly, in early 2023, crossing this benchmark preceded a robust 58% appreciation.
Market analyst Dami-Defi shared on X that piercing through the $2,400–$2,600 corridor would unleash the “most violent move of the year” propelling prices toward $3,000, declaring: “Once we break $2,400 we will catapult violently to $2,800–$3,000.” The analysis emphasized a distinct accumulation zone evident on weekly timeframe charts.
Technical Bull Flag Configuration Suggests $3,018 Objective
On daily timeframes, Ethereum has developed a textbook bull flag continuation pattern. Price action is presently testing the $2,350 resistance threshold, where the flag’s upper trendline intersects with the 100-day exponential moving average.

A confirmed daily candle closure above this critical juncture would activate a measured move calculation pointing to $3,018. Technical analyst Cohelson David separately recognized a broadening wedge structure on 12-hour charts also projecting toward the $3,000 region.
The Relative Strength Index has rebounded to 56 from deeply oversold conditions at 36 registered in late March, demonstrating renewed accumulation pressure.
Critical Resistance Barrier at $2,800 Level
Notwithstanding the constructive technical framework, a substantial impediment exists in the $2,750 to $2,850 price band. Approximately 7.1 million ETH tokens were originally purchased within this cost range, establishing a concentration zone where numerous participants may seek to exit positions at breakeven prices.
Cryptocurrency analyst Crypto Patel identified $2,400, $2,700, and $3,000 as the primary resistance levels warranting attention. He cautioned that inability to penetrate $2,400 could trigger retracement toward the $2,000 support foundation.
The MACD indicator at 25.03 remains positioned beneath the signal line of 32.00, with a histogram value of -6.97, indicating momentum is experiencing slight deterioration in the immediate term.
Near-term support is established at $2,323, with additional support floors located at $2,219 and $2,179. Ethereum’s total market capitalization currently stands at $282.39 billion.
ETH is presently exchanging hands above $2,360 and the 100-hour simple moving average, with a bullish trendline providing support at $2,350 on the hourly timeframe chart.