
 Stock Faces Critical Test as May Volatility Season Begins")
Key Takeaways
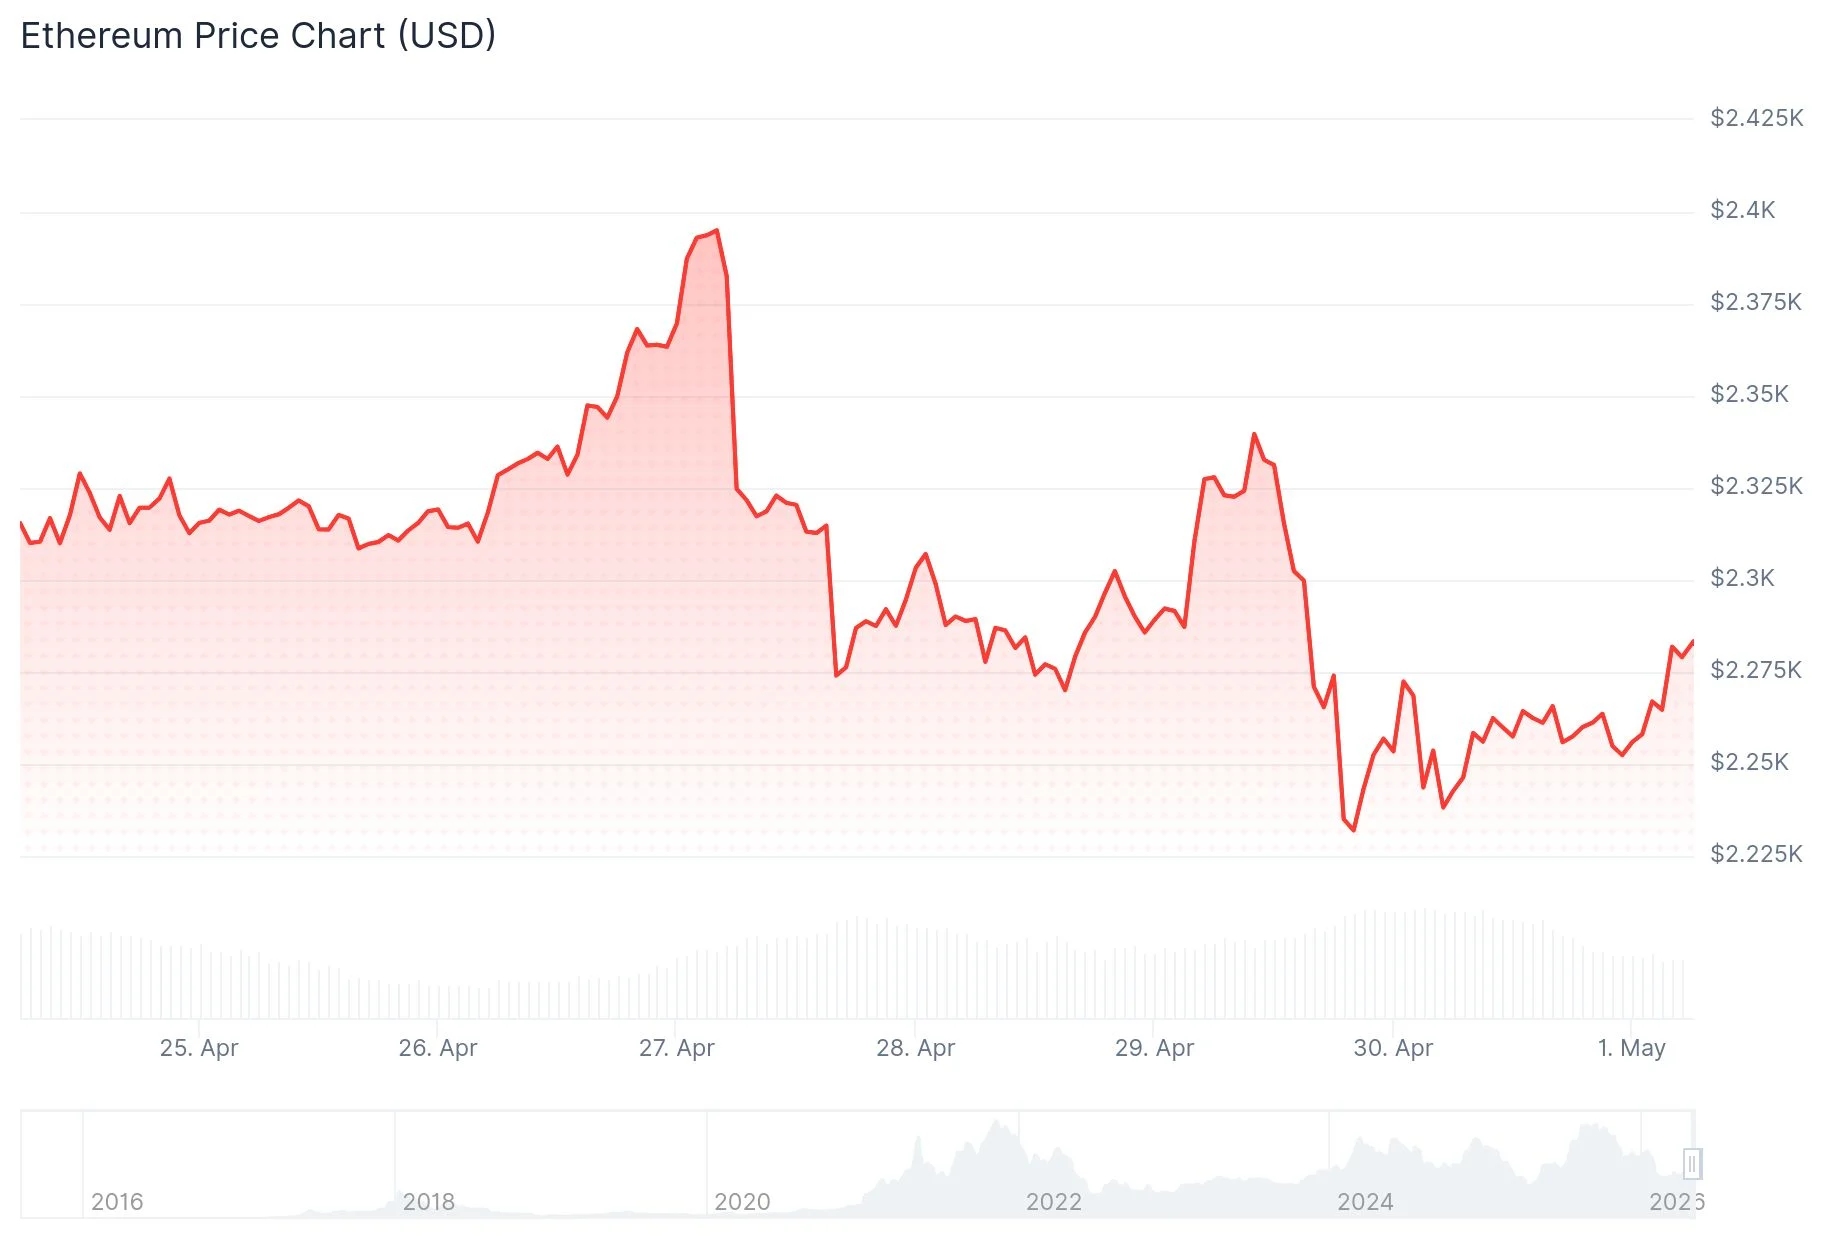
- Ethereum currently sits at approximately $2,260, pressured by elevated US inflation figures and broader macroeconomic uncertainty.
- Derivatives market indicators reveal negative taker buy-sell ratios alongside negative funding rates, signaling bearish near-term momentum.
- Market observer Ted Pillows highlights that breaching the $2,150–$2,200 range could accelerate downward pressure.
- Binance-specific derivatives metrics show contrasting bullish signals, with taker buy-sell ratios exceeding 1.
- Historical trends indicate May consistently delivers extreme volatility for Ethereum, producing significant price movements in either direction.
Ethereum maintains a position around $2,260 while macroeconomic pressures and conflicting futures market signals define the immediate trajectory as May unfolds.
The Personal Consumption Expenditures Price Index in the United States registered a 3.5% annual increase for March, advancing from the previous 2.8%. Core PCE, which serves as the Federal Reserve’s primary inflation gauge, reached 3.2% — marking the highest reading since November 2023. Elevated inflation typically diminishes expectations for rate reductions, generally dampening enthusiasm for risk assets including cryptocurrencies.
Ongoing geopolitical instability in Middle Eastern regions continues contributing to defensive positioning across global financial instruments.
Within Ethereum’s perpetual futures landscape, the taker buy-sell ratio has dipped below zero. This indicator measures the balance between market order buyers versus sellers in perpetual contract trading. The 14-day moving average has demonstrated consistent decline throughout the latter half of April.


ETH funding rates have similarly remained in negative territory throughout this timeframe. When funding rates turn negative, it indicates short position holders are compensating long holders, reflecting prevailing bearish sentiment among leveraged traders.
Total open interest has stabilized near 13.5 million ETH, representing a decrease from the 14.4 million ETH recorded on April 18. This contraction implies traders are reducing exposure rather than establishing fresh positions.
Critical Support and Resistance Zones
Technically, ETH continues trading beneath its 20-day exponential moving average positioned at $2,287 and the 100-day EMA located around $2,365. The Relative Strength Index currently lingers near the neutral 50 threshold, whereas the Stochastic Oscillator indicates oversold conditions.
Ethereum’s realized price — representing the network-wide average acquisition cost — stands at $2,308, functioning as overhead resistance. Recent attempts to surpass this level have faltered, suggesting profit-taking at breakeven points.
Immediate support establishes itself at $2,211, with the 50-day EMA positioned near $2,244. Sequential support levels beneath include $2,108, $1,909, and $1,741.
Cryptocurrency analyst Ted Pillows identified the $2,150–$2,200 range as particularly significant, warning that if ETH penetrates below this zone, “the dump will accelerate.” He considers this area a potential foundation for renewed upward momentum.
Liquidations totaling $38.2 million occurred across the past 24 hours, with short position liquidations accounting for $19.5 million.
Binance Metrics Suggest Contrarian Optimism
Exclusively on Binance, the taker buy-sell ratio exceeds 1, based on CryptoQuant analytics referenced by analyst Rei Researcher. This diverges from broader market trends. The data indicates that within Binance’s ecosystem, buying pressure currently outweighs selling momentum.
Open interest has experienced modest elevation from recent bottoms, suggesting incremental accumulation of long positions. Nevertheless, overall leverage expansion remains constrained, diminishing the probability of cascading liquidation events.
Historical May Volatility Tendencies
Archival statistics from CoinGlass demonstrate that May ranks among Ethereum’s most turbulent calendar months. Both mean and median returns throughout May occupy extremes relative to other months — characterized by amplified gains and steeper losses.
Trader Daan Crypto Trades emphasized this cyclical behavior, observing that May characteristically generates exaggerated movements rather than gradual directional trends.
ETH commenced May 2026 with pricing near $2,261.